| Param | Original file | Final file |
|---|---|---|
| Filename | modeM0/AS1G06_168T04_9000000820cztM0_level2.evt | modeM0/AS1G06_168T04_9000000820cztM0_level2_quad_clean.evt |
| Size (bytes) | 1,555,908,480 | 225,976,320 |
| Size | 1.4 GB | 215.5 MB |
| Events in quadrant A | 8,931,372 | 1,404,257 |
| Events in quadrant B | 10,021,544 | 1,409,729 |
| Events in quadrant C | 8,541,365 | 1,414,331 |
| Events in quadrant D | 18,265,999 | 1,228,132 |
| Mode M0 | |||
|---|---|---|---|
| Quadrant | BADHDUFLAG | Total packets | Discarded packets |
| A | 0 | 41075 | 0 |
| B | 0 | 43620 | 0 |
| C | 0 | 40617 | 0 |
| D | 0 | 68457 | 0 |
| Mode M9 | |||
|---|---|---|---|
| Quadrant | BADHDUFLAG | Total packets | Discarded packets |
| A | 0 | 25 | 0 |
| B | 0 | 25 | 0 |
| C | 0 | 25 | 0 |
| D | 0 | 25 | 0 |
| Mode SS | |||
|---|---|---|---|
| Quadrant | BADHDUFLAG | Total packets | Discarded packets |
| A | 0 | 408 | 0 |
| B | 0 | 408 | 0 |
| C | 0 | 408 | 0 |
| D | 0 | 408 | 0 |
| Quadrant | Total seconds | Saturated seconds | Saturation percentage |
|---|---|---|---|
| A | 20136 | 135 | 0.670441% |
| B | 20136 | 326 | 1.618991% |
| C | 20136 | 94 | 0.466826% |
| D | 20136 | 3311 | 16.443186% |
Noise dominated data is calculated using 1-second bins in cleaned event files. If a bin has >2000 counts, and if more than 50% of those come from <1% of pixels, then it is considered to be noise-dominated and hence unusable.
| Quadrant | # 1 sec bins | Bins with >0 counts | Bins with >2000 counts | High rate bins dominated by noise | Noise dominated (total time) | Noise dominated (detector-on time) | Marked lightcurve |
|---|---|---|---|---|---|---|---|
| A | 22552 | 20137 | 31 | 31 | 0.14% | 0.15% | 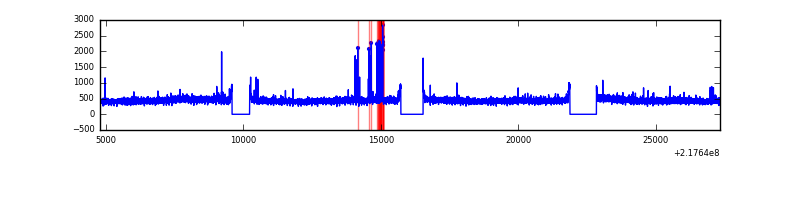 |
| B | 22552 | 20137 | 178 | 178 | 0.79% | 0.88% |  |
| C | 22552 | 20136 | 0 | 0 | 0.00% | 0.00% |  |
| D | 22552 | 20136 | 3159 | 3159 | 14.01% | 15.69% |  |
Top three noisy pixels from each quadrant. If the there are fewer than three noisy pixels in the level2.evt file, extra rows are filled as -1
| Pixel properties | Quadrant properties | ||||||
|---|---|---|---|---|---|---|---|
| Quadrant | DetID | PixID | Counts | Sigma | Mean | Median | Sigma |
| A | 15 | 236 | 161375 | 349.73 | 2246 | 2194 | 455.2 |
| A | 8 | 15 | 44405 | 92.74 | 2246 | 2194 | 455.2 |
| A | 0 | 226 | 21517 | 42.45 | 2246 | 2194 | 455.2 |
| B | 3 | 64 | 632462 | 1468.51 | 2253 | 2196 | 429.2 |
| B | 0 | 219 | 349127 | 808.35 | 2253 | 2196 | 429.2 |
| B | 11 | 51 | 205215 | 473.03 | 2253 | 2196 | 429.2 |
| C | 13 | 61 | 17039 | 29.57 | 2185 | 2187 | 502.2 |
| C | 8 | 222 | 9552 | 14.66 | 2185 | 2187 | 502.2 |
| C | 14 | 67 | 6695 | 8.98 | 2185 | 2187 | 502.2 |
| D | 13 | 105 | 8259009 | 16963.03 | 2006 | 1939 | 486.8 |
| D | 12 | 220 | 1743804 | 3578.42 | 2006 | 1939 | 486.8 |
| D | 12 | 110 | 290945 | 593.72 | 2006 | 1939 | 486.8 |
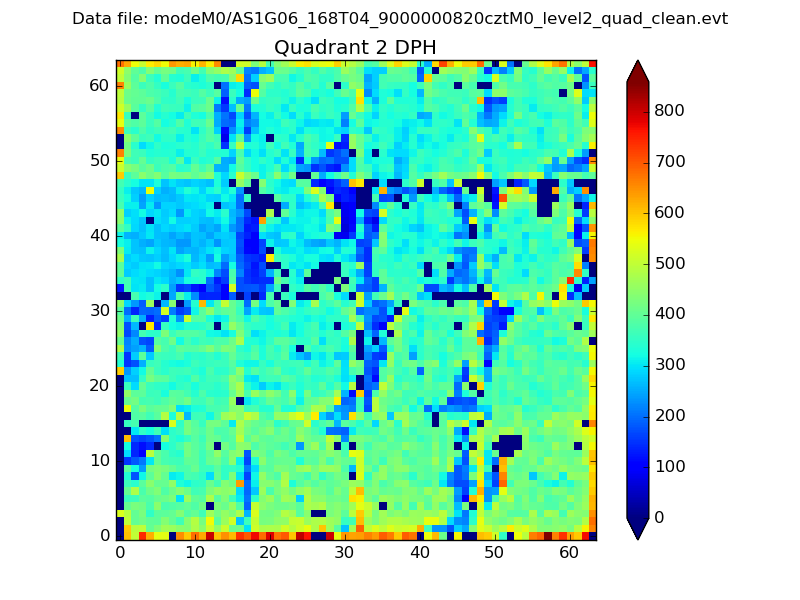
Histogram calculated using DETX and DETY for each event in the final _common_clean file
| Quadrant A |  |
 |
Quadrant B |
|---|---|---|---|
| Quadrant D | 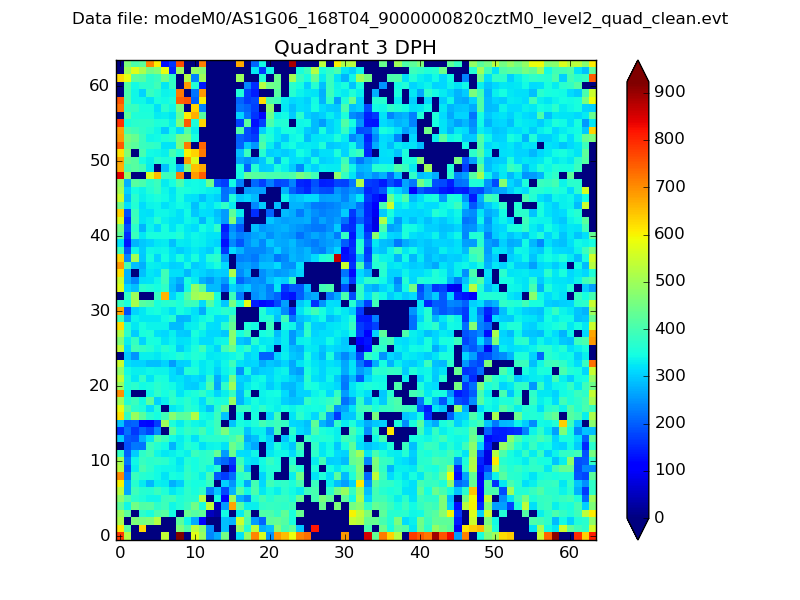 |
 |
Quadrant C |
| Plot type | Count rate plots | Images |
|---|---|---|
| Comparison with Poisson distribution Blue bars denote a histogram of data divided into 1 sec bins. Red curve is a Poisson curve with rate = median count rate of data. |
 |
 |
| Quadrant-wise count rates Data is divided into 100 sec bins |
 |
|
| Module-wise count rates for Quadrant A Data is divided into 100 sec bins |
 |
 |
| Module-wise count rates for Quadrant B Data is divided into 100 sec bins |
 |
 |
| Module-wise count rates for Quadrant C Data is divided into 100 sec bins |
 |
 |
| Module-wise count rates for Quadrant D Data is divided into 100 sec bins |
 |
 |
| Parameter | Plot |
|---|---|
| CZT HV Monitor | 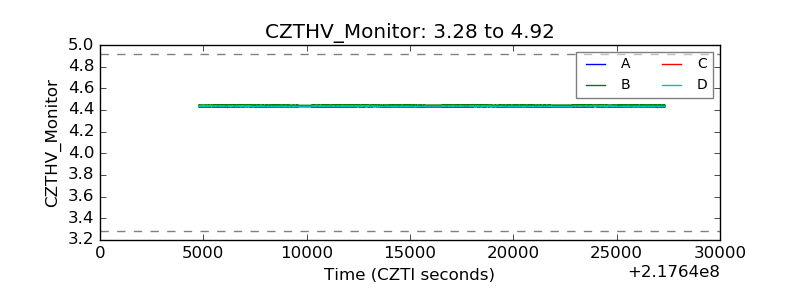 |
| D_VDD |  |
| Temperature 1 |  |
| Veto HV Monitor |  |
| Veto LLD |  |
| Alpha Counter |  |
| _CPM_Rate | 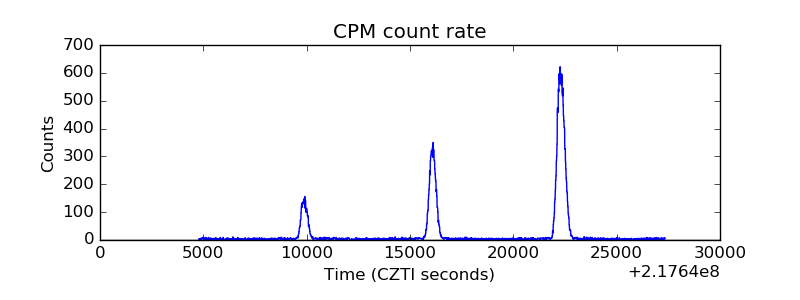 |
| CZT Counter |  |
| +2.5 Volts monitor |  |
| +5 Volts monitor |  |
| _ROLL_ROT |  |
| _Roll_DEC |  |
| _Roll_RA |  |
| Veto Counter |  |