| Param | Original file | Final file |
|---|---|---|
| Filename | modeM0/AS1C02_018T01_9000000822cztM0_level2_bc.evt | modeM0/AS1C02_018T01_9000000822cztM0_level2_quad_clean.evt |
| Size (bytes) | 2,054,393,280 | 578,761,920 |
| Size | 1.9 GB | 552.0 MB |
| Events in quadrant A | 12,589,942 | 3,618,648 |
| Events in quadrant B | 13,396,255 | 3,628,334 |
| Events in quadrant C | 9,086,852 | 3,710,870 |
| Events in quadrant D | 23,966,580 | 3,369,104 |
| Mode SS | |||
|---|---|---|---|
| Quadrant | BADHDUFLAG | Total packets | Discarded packets |
| A | 0 | 956 | 0 |
| B | 0 | 956 | 0 |
| C | 0 | 956 | 0 |
| D | 0 | 956 | 0 |
| Mode M0 | |||
|---|---|---|---|
| Quadrant | BADHDUFLAG | Total packets | Discarded packets |
| A | 0 | 106543 | 0 |
| B | 0 | 111850 | 0 |
| C | 0 | 95983 | 0 |
| D | 0 | 151758 | 0 |
| Mode M9 | |||
|---|---|---|---|
| Quadrant | BADHDUFLAG | Total packets | Discarded packets |
| A | 0 | 80 | 0 |
| B | 0 | 80 | 0 |
| C | 0 | 80 | 0 |
| D | 0 | 80 | 0 |
| Quadrant | Total seconds | Saturated seconds | Saturation percentage |
|---|---|---|---|
| A | 46646 | 694 | 1.487802% |
| B | 46646 | 1374 | 2.945590% |
| C | 46646 | 272 | 0.583115% |
| D | 46646 | 3689 | 7.908502% |
Noise dominated data is calculated using 1-second bins in cleaned event files. If a bin has >2000 counts, and if more than 50% of those come from <1% of pixels, then it is considered to be noise-dominated and hence unusable.
| Quadrant | # 1 sec bins | Bins with >0 counts | Bins with >2000 counts | High rate bins dominated by noise | Noise dominated (total time) | Noise dominated (detector-on time) | Marked lightcurve |
|---|---|---|---|---|---|---|---|
| A | 53720 | 46642 | 2 | 2 | 0.00% | 0.00% |  |
| B | 53720 | 46642 | 107 | 107 | 0.20% | 0.23% | 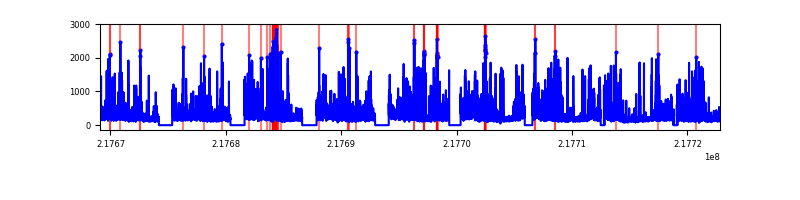 |
| C | 53720 | 46645 | 2 | 2 | 0.00% | 0.00% | 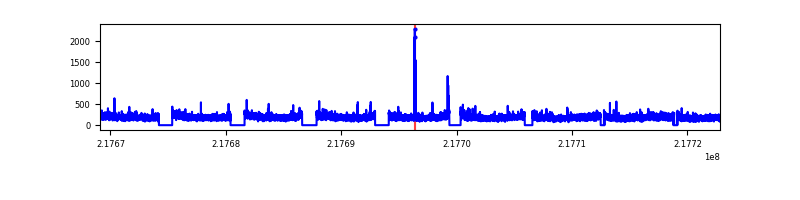 |
| D | 53720 | 46641 | 289 | 289 | 0.54% | 0.62% |  |
Top three noisy pixels from each quadrant. If the there are fewer than three noisy pixels in the level2.evt file, extra rows are filled as -1
| Pixel properties | Quadrant properties | ||||||
|---|---|---|---|---|---|---|---|
| Quadrant | DetID | PixID | Counts | Sigma | Mean | Median | Sigma |
| A | 8 | 15 | 2583646 | 5055.58 | 2314 | 2263 | 510.6 |
| A | 15 | 236 | 573880 | 1119.5 | 2314 | 2263 | 510.6 |
| A | 3 | 80 | 220956 | 428.3 | 2314 | 2263 | 510.6 |
| B | 3 | 64 | 1379827 | 3094.09 | 2318 | 2245 | 445.2 |
| B | 0 | 219 | 680765 | 1523.98 | 2318 | 2245 | 445.2 |
| B | 5 | 172 | 671263 | 1502.63 | 2318 | 2245 | 445.2 |
| C | 9 | 54 | 59525 | 113.56 | 2288 | 2252 | 504.3 |
| C | 8 | 128 | 21024 | 37.22 | 2288 | 2252 | 504.3 |
| C | 8 | 222 | 20931 | 37.04 | 2288 | 2252 | 504.3 |
| D | 12 | 220 | 10741544 | 19990.37 | 2227 | 2129 | 537.2 |
| D | 2 | 63 | 1038716 | 1929.5 | 2227 | 2129 | 537.2 |
| D | 12 | 221 | 822007 | 1526.12 | 2227 | 2129 | 537.2 |
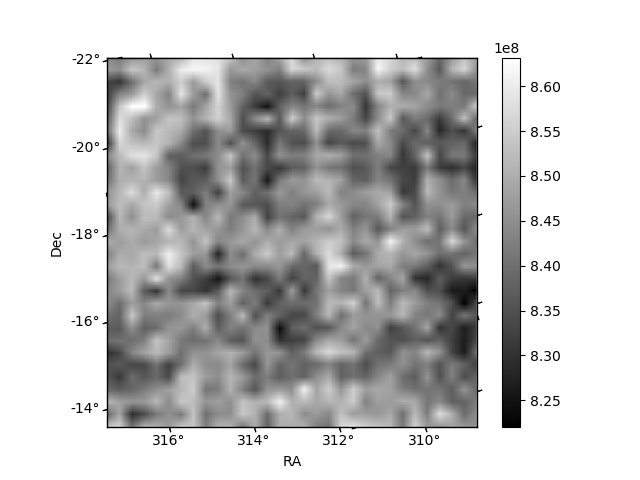
Histogram calculated using DETX and DETY for each event in the final _common_clean file
| Quadrant A |  |
 |
Quadrant B |
|---|---|---|---|
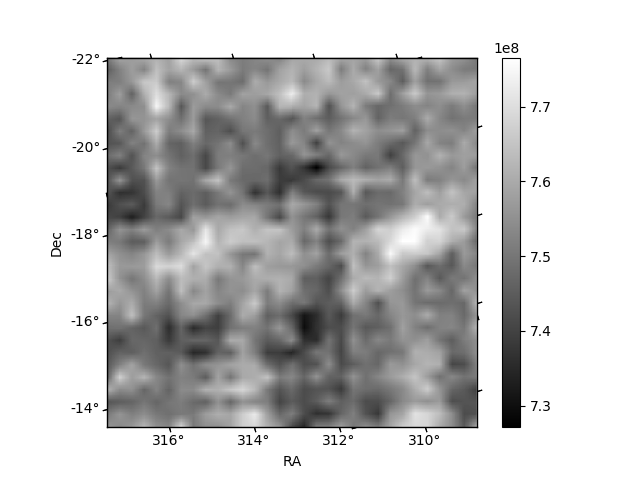
| Quadrant D |  |
 |
Quadrant C |
| Plot type | Count rate plots | Images |
|---|---|---|
| Comparison with Poisson distribution Blue bars denote a histogram of data divided into 1 sec bins. Red curve is a Poisson curve with rate = median count rate of data. |
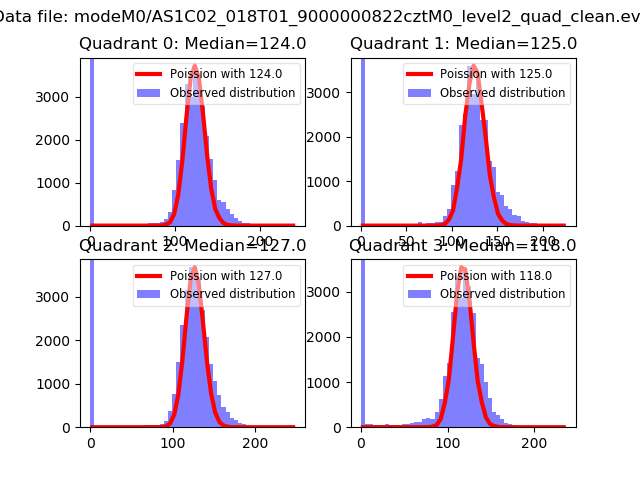 |
 |
| Quadrant-wise count rates Data is divided into 100 sec bins |
 |
|
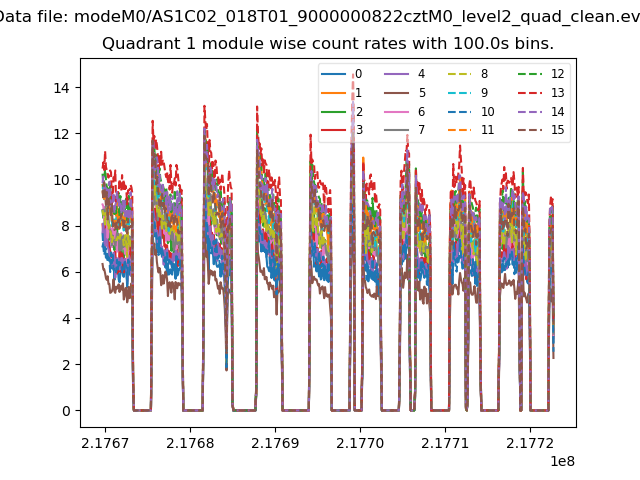
| Module-wise count rates for Quadrant A Data is divided into 100 sec bins |
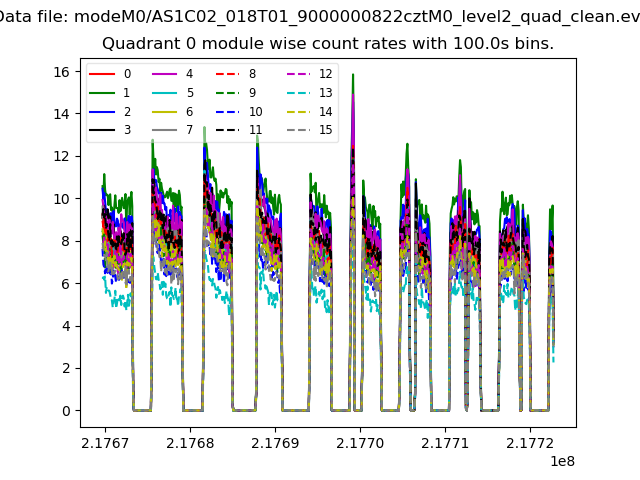 |
 |
| Module-wise count rates for Quadrant B Data is divided into 100 sec bins |
 |
 |
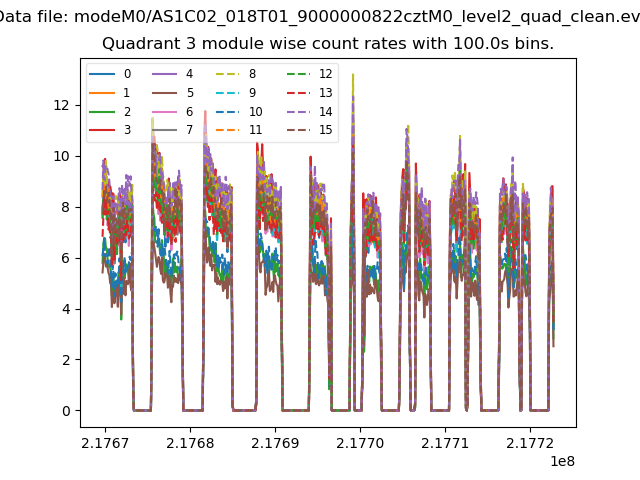
| Module-wise count rates for Quadrant C Data is divided into 100 sec bins |
 |
 |
| Module-wise count rates for Quadrant D Data is divided into 100 sec bins |
 |
 |
| Parameter | Plot |
|---|---|
| CZT HV Monitor |  |
| D_VDD |  |
| Temperature 1 |  |
| Veto HV Monitor | 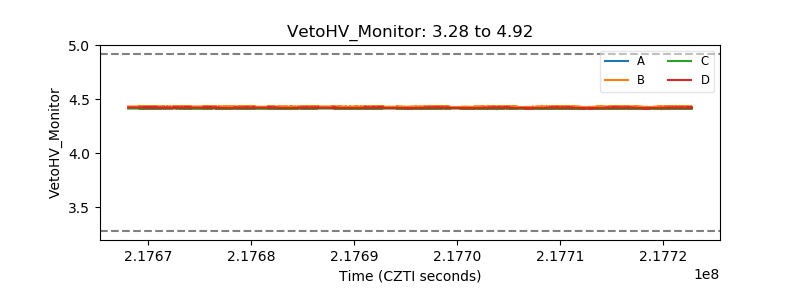 |
| Veto LLD |  |
| Alpha Counter |  |
| _CPM_Rate | 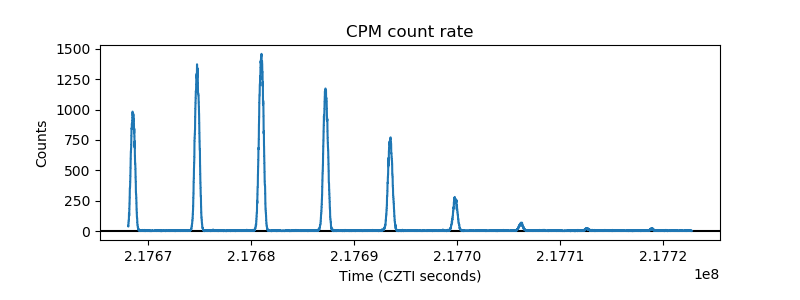 |
| CZT Counter |  |
| +2.5 Volts monitor | 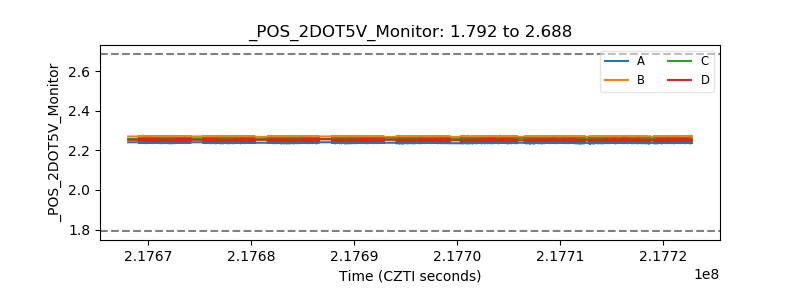 |
| +5 Volts monitor |  |
| _ROLL_ROT |  |
| _Roll_DEC |  |
| _Roll_RA |  |
| Veto Counter |  |