| Param | Original file | Final file |
|---|---|---|
| Filename | modeM0/AS1A02_151T01_9000000818cztM0_level2.evt | modeM0/AS1A02_151T01_9000000818cztM0_level2_quad_clean.evt |
| Size (bytes) | 7,302,147,840 | 1,399,685,760 |
| Size | 6.8 GB | 1.3 GB |
| Events in quadrant A | 50,506,662 | 8,894,962 |
| Events in quadrant B | 55,560,391 | 8,907,224 |
| Events in quadrant C | 47,142,509 | 8,816,928 |
| Events in quadrant D | 60,685,562 | 8,412,988 |
| Mode SS | |||
|---|---|---|---|
| Quadrant | BADHDUFLAG | Total packets | Discarded packets |
| A | 0 | 2190 | 0 |
| B | 0 | 2194 | 0 |
| C | 0 | 2192 | 0 |
| D | 0 | 2194 | 0 |
| Mode M0 | |||
|---|---|---|---|
| Quadrant | BADHDUFLAG | Total packets | Discarded packets |
| A | 0 | 224669 | 0 |
| B | 0 | 239031 | 0 |
| C | 0 | 219390 | 0 |
| D | 0 | 255540 | 0 |
| Mode M9 | |||
|---|---|---|---|
| Quadrant | BADHDUFLAG | Total packets | Discarded packets |
| A | 0 | 171 | 0 |
| B | 0 | 173 | 0 |
| C | 0 | 173 | 0 |
| D | 0 | 173 | 0 |
| Quadrant | Total seconds | Saturated seconds | Saturation percentage |
|---|---|---|---|
| A | 107461 | 1300 | 1.209741% |
| B | 107450 | 2669 | 2.483946% |
| C | 107467 | 788 | 0.733248% |
| D | 107381 | 2435 | 2.267626% |
Noise dominated data is calculated using 1-second bins in cleaned event files. If a bin has >2000 counts, and if more than 50% of those come from <1% of pixels, then it is considered to be noise-dominated and hence unusable.
| Quadrant | # 1 sec bins | Bins with >0 counts | Bins with >2000 counts | High rate bins dominated by noise | Noise dominated (total time) | Noise dominated (detector-on time) | Marked lightcurve |
|---|---|---|---|---|---|---|---|
| A | 157955 | 107734 | 79 | 79 | 0.05% | 0.07% |  |
| B | 157955 | 107706 | 1114 | 1114 | 0.71% | 1.03% |  |
| C | 157954 | 107724 | 0 | 0 | 0.00% | 0.00% |  |
| D | 157955 | 107615 | 1333 | 1333 | 0.84% | 1.24% |  |
Top three noisy pixels from each quadrant. If the there are fewer than three noisy pixels in the level2.evt file, extra rows are filled as -1
| Pixel properties | Quadrant properties | ||||||
|---|---|---|---|---|---|---|---|
| Quadrant | DetID | PixID | Counts | Sigma | Mean | Median | Sigma |
| A | 15 | 236 | 1535085 | 608.6 | 12422 | 12168 | 2502.3 |
| A | 8 | 15 | 619014 | 242.51 | 12422 | 12168 | 2502.3 |
| A | 14 | 111 | 243207 | 92.33 | 12422 | 12168 | 2502.3 |
| B | 3 | 64 | 4899324 | 2057.33 | 12488 | 12187 | 2375.5 |
| B | 0 | 219 | 1300809 | 542.47 | 12488 | 12187 | 2375.5 |
| B | 15 | 204 | 348079 | 141.4 | 12488 | 12187 | 2375.5 |
| C | 13 | 61 | 95200 | 30.01 | 12073 | 12120 | 2768.7 |
| C | 8 | 222 | 41113 | 10.47 | 12073 | 12120 | 2768.7 |
| C | 3 | 202 | 30730 | 6.72 | 12073 | 12120 | 2768.7 |
| D | 12 | 220 | 6097833 | 2098.53 | 11989 | 11619 | 2900.2 |
| D | 2 | 63 | 3500522 | 1202.98 | 11989 | 11619 | 2900.2 |
| D | 11 | 241 | 1974818 | 676.91 | 11989 | 11619 | 2900.2 |
Histogram calculated using DETX and DETY for each event in the final _common_clean file
| Quadrant A |  |
 |
Quadrant B |
|---|---|---|---|
| Quadrant D |  |
 |
Quadrant C |
| Plot type | Count rate plots | Images |
|---|---|---|
| Comparison with Poisson distribution Blue bars denote a histogram of data divided into 1 sec bins. Red curve is a Poisson curve with rate = median count rate of data. |
 |
 |
| Quadrant-wise count rates Data is divided into 100 sec bins |
 |
|
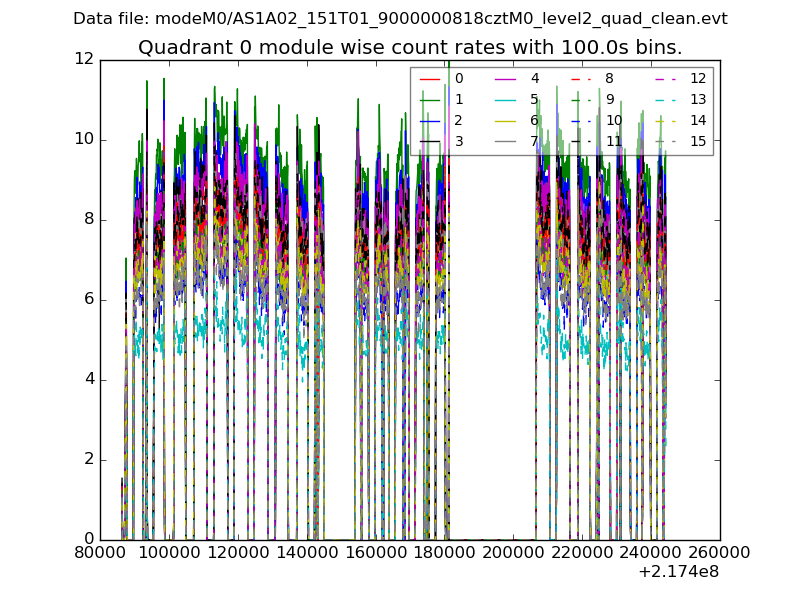
| Module-wise count rates for Quadrant A Data is divided into 100 sec bins |
 |
 |
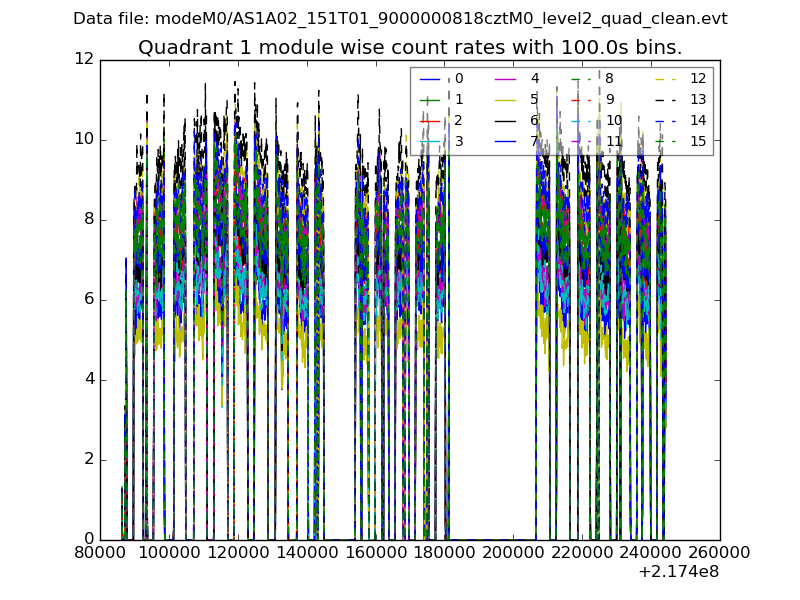
| Module-wise count rates for Quadrant B Data is divided into 100 sec bins |
 |
 |
| Module-wise count rates for Quadrant C Data is divided into 100 sec bins |
 |
 |
| Module-wise count rates for Quadrant D Data is divided into 100 sec bins |
 |
 |
| Parameter | Plot |
|---|---|
| CZT HV Monitor | 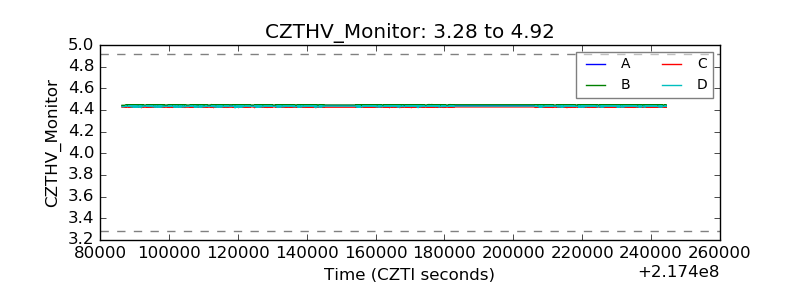 |
| D_VDD |  |
| Temperature 1 |  |
| Veto HV Monitor | 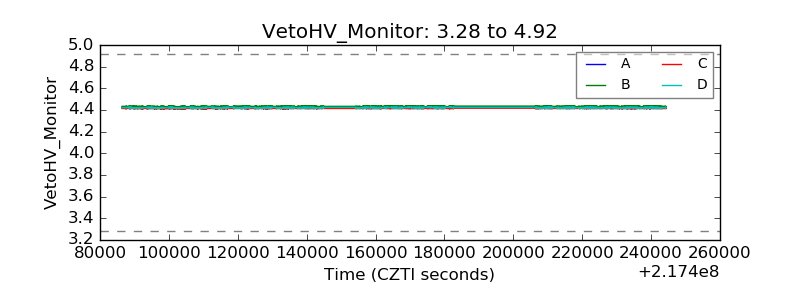 |
| Veto LLD |  |
| Alpha Counter |  |
| _CPM_Rate |  |
| CZT Counter |  |
| +2.5 Volts monitor |  |
| +5 Volts monitor |  |
| _ROLL_ROT |  |
| _Roll_DEC |  |
| _Roll_RA |  |
| Veto Counter |  |