| Param | Original file | Final file |
|---|---|---|
| Filename | modeM0/AS1A02_046T01_9000000814cztM0_level2_bc.evt | modeM0/AS1A02_046T01_9000000814cztM0_level2_quad_clean.evt |
| Size (bytes) | 819,475,200 | 421,344,000 |
| Size | 781.5 MB | 401.8 MB |
| Events in quadrant A | 7,301,294 | 2,808,583 |
| Events in quadrant B | 5,154,686 | 2,845,645 |
| Events in quadrant C | 4,570,809 | 2,825,174 |
| Events in quadrant D | 6,231,386 | 2,714,306 |
| Mode M9 | |||
|---|---|---|---|
| Quadrant | BADHDUFLAG | Total packets | Discarded packets |
| A | 0 | 46 | 0 |
| B | 0 | 46 | 0 |
| C | 0 | 46 | 0 |
| D | 0 | 46 | 0 |
| Mode M0 | |||
|---|---|---|---|
| Quadrant | BADHDUFLAG | Total packets | Discarded packets |
| A | 0 | 54522 | 0 |
| B | 0 | 48636 | 0 |
| C | 0 | 46598 | 0 |
| D | 0 | 50852 | 0 |
| Mode SS | |||
|---|---|---|---|
| Quadrant | BADHDUFLAG | Total packets | Discarded packets |
| A | 0 | 468 | 0 |
| B | 0 | 468 | 0 |
| C | 0 | 466 | 0 |
| D | 0 | 468 | 0 |
| Quadrant | Total seconds | Saturated seconds | Saturation percentage |
|---|---|---|---|
| A | 22794 | 499 | 2.189173% |
| B | 22797 | 378 | 1.658113% |
| C | 22796 | 250 | 1.096684% |
| D | 22794 | 318 | 1.395104% |
Noise dominated data is calculated using 1-second bins in cleaned event files. If a bin has >2000 counts, and if more than 50% of those come from <1% of pixels, then it is considered to be noise-dominated and hence unusable.
| Quadrant | # 1 sec bins | Bins with >0 counts | Bins with >2000 counts | High rate bins dominated by noise | Noise dominated (total time) | Noise dominated (detector-on time) | Marked lightcurve |
|---|---|---|---|---|---|---|---|
| A | 32677 | 22796 | 20 | 20 | 0.06% | 0.09% |  |
| B | 32677 | 22796 | 9 | 9 | 0.03% | 0.04% |  |
| C | 32677 | 22796 | 0 | 0 | 0.00% | 0.00% |  |
| D | 32677 | 22797 | 5 | 5 | 0.02% | 0.02% |  |
Top three noisy pixels from each quadrant. If the there are fewer than three noisy pixels in the level2.evt file, extra rows are filled as -1
| Pixel properties | Quadrant properties | ||||||
|---|---|---|---|---|---|---|---|
| Quadrant | DetID | PixID | Counts | Sigma | Mean | Median | Sigma |
| A | 13 | 34 | 2254954 | 8729.94 | 1176 | 1153 | 258.2 |
| A | 8 | 15 | 244705 | 943.38 | 1176 | 1153 | 258.2 |
| A | 0 | 31 | 223495 | 861.23 | 1176 | 1153 | 258.2 |
| B | 0 | 219 | 171169 | 759.78 | 1184 | 1155 | 223.8 |
| B | 15 | 204 | 157983 | 700.86 | 1184 | 1155 | 223.8 |
| B | 0 | 214 | 75648 | 332.91 | 1184 | 1155 | 223.8 |
| C | 1 | 16 | 18732 | 68.3 | 1159 | 1143 | 257.5 |
| C | 8 | 222 | 10015 | 34.45 | 1159 | 1143 | 257.5 |
| C | 13 | 61 | 7371 | 24.18 | 1159 | 1143 | 257.5 |
| D | 2 | 63 | 900032 | 3280.34 | 1169 | 1126 | 274.0 |
| D | 12 | 221 | 277520 | 1008.63 | 1169 | 1126 | 274.0 |
| D | 2 | 136 | 132348 | 478.86 | 1169 | 1126 | 274.0 |
Histogram calculated using DETX and DETY for each event in the final _common_clean file
| Quadrant A |  |
 |
Quadrant B |
|---|---|---|---|
| Quadrant D | 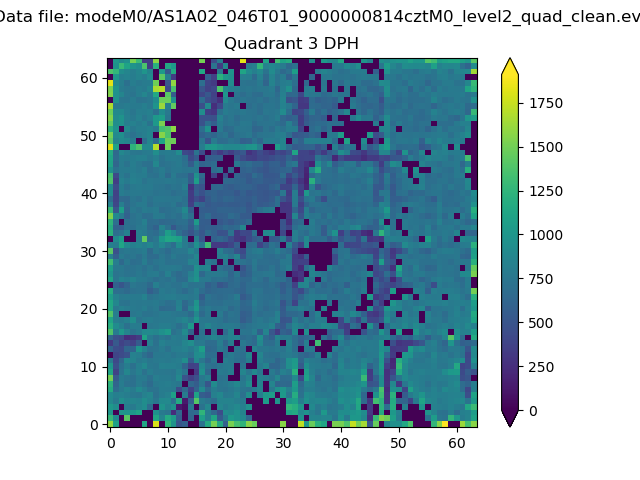 |
 |
Quadrant C |
| Plot type | Count rate plots | Images |
|---|---|---|
| Comparison with Poisson distribution Blue bars denote a histogram of data divided into 1 sec bins. Red curve is a Poisson curve with rate = median count rate of data. |
 |
 |
| Quadrant-wise count rates Data is divided into 100 sec bins |
 |
|
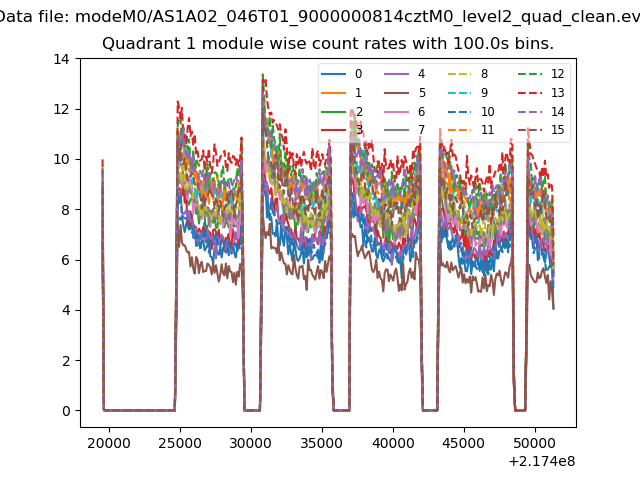
| Module-wise count rates for Quadrant A Data is divided into 100 sec bins |
 |
 |
| Module-wise count rates for Quadrant B Data is divided into 100 sec bins |
 |
 |
| Module-wise count rates for Quadrant C Data is divided into 100 sec bins |
 |
 |
| Module-wise count rates for Quadrant D Data is divided into 100 sec bins |
 |
 |
| Parameter | Plot |
|---|---|
| CZT HV Monitor |  |
| D_VDD |  |
| Temperature 1 |  |
| Veto HV Monitor |  |
| Veto LLD |  |
| Alpha Counter |  |
| _CPM_Rate |  |
| CZT Counter | 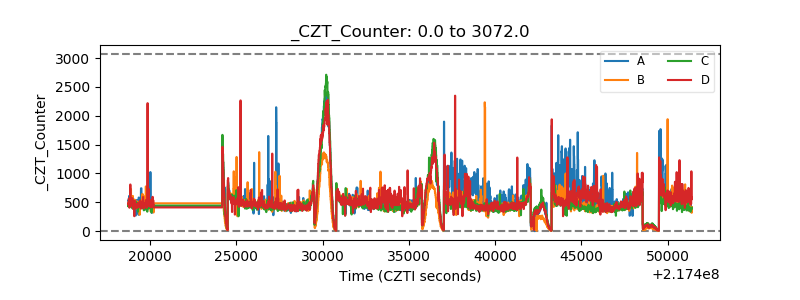 |
| +2.5 Volts monitor |  |
| +5 Volts monitor | 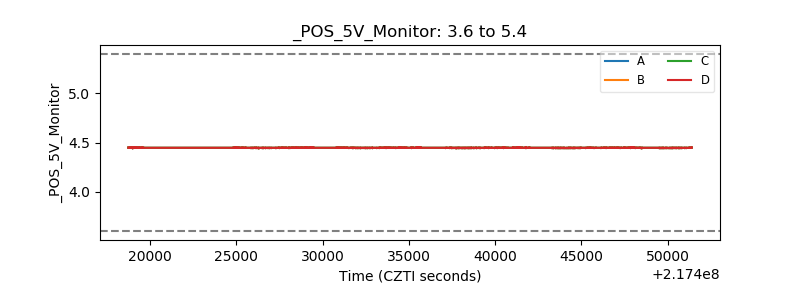 |
| _ROLL_ROT |  |
| _Roll_DEC | 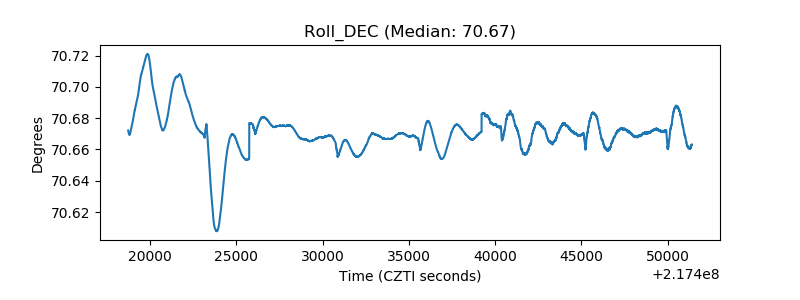 |
| _Roll_RA |  |
| Veto Counter |  |