| Param | Original file | Final file |
|---|---|---|
| Filename | modeM0/AS1G06_168T05_9000000810cztM0_level2.evt | modeM0/AS1G06_168T05_9000000810cztM0_level2_quad_clean.evt |
| Size (bytes) | 900,912,960 | 155,076,480 |
| Size | 859.2 MB | 147.9 MB |
| Events in quadrant A | 6,134,436 | 945,763 |
| Events in quadrant B | 7,312,122 | 946,406 |
| Events in quadrant C | 6,032,353 | 950,145 |
| Events in quadrant D | 6,881,319 | 911,990 |
| Mode M9 | |||
|---|---|---|---|
| Quadrant | BADHDUFLAG | Total packets | Discarded packets |
| A | 0 | 10 | 0 |
| B | 0 | 10 | 0 |
| C | 0 | 10 | 0 |
| D | 0 | 10 | 0 |
| Mode SS | |||
|---|---|---|---|
| Quadrant | BADHDUFLAG | Total packets | Discarded packets |
| A | 0 | 278 | 0 |
| B | 0 | 278 | 0 |
| C | 0 | 278 | 0 |
| D | 0 | 278 | 0 |
| Mode M0 | |||
|---|---|---|---|
| Quadrant | BADHDUFLAG | Total packets | Discarded packets |
| A | 0 | 27650 | 0 |
| B | 0 | 30889 | 0 |
| C | 0 | 27668 | 0 |
| D | 0 | 29887 | 0 |
| Quadrant | Total seconds | Saturated seconds | Saturation percentage |
|---|---|---|---|
| A | 13638 | 66 | 0.483942% |
| B | 13638 | 277 | 2.031090% |
| C | 13638 | 60 | 0.439947% |
| D | 13638 | 94 | 0.689251% |
Noise dominated data is calculated using 1-second bins in cleaned event files. If a bin has >2000 counts, and if more than 50% of those come from <1% of pixels, then it is considered to be noise-dominated and hence unusable.
| Quadrant | # 1 sec bins | Bins with >0 counts | Bins with >2000 counts | High rate bins dominated by noise | Noise dominated (total time) | Noise dominated (detector-on time) | Marked lightcurve |
|---|---|---|---|---|---|---|---|
| A | 14688 | 13640 | 0 | 0 | 0.00% | 0.00% | 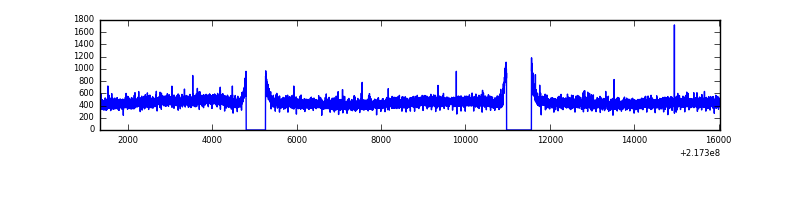 |
| B | 14688 | 13639 | 127 | 127 | 0.86% | 0.93% |  |
| C | 14688 | 13640 | 2 | 2 | 0.01% | 0.01% |  |
| D | 14688 | 13640 | 28 | 28 | 0.19% | 0.21% |  |
Top three noisy pixels from each quadrant. If the there are fewer than three noisy pixels in the level2.evt file, extra rows are filled as -1
| Pixel properties | Quadrant properties | ||||||
|---|---|---|---|---|---|---|---|
| Quadrant | DetID | PixID | Counts | Sigma | Mean | Median | Sigma |
| A | 8 | 15 | 39711 | 118.92 | 1579 | 1548 | 320.9 |
| A | 0 | 226 | 15076 | 42.16 | 1579 | 1548 | 320.9 |
| A | 12 | 194 | 14990 | 41.89 | 1579 | 1548 | 320.9 |
| B | 3 | 64 | 1018747 | 3313.41 | 1583 | 1542 | 307.0 |
| B | 0 | 219 | 86625 | 277.15 | 1583 | 1542 | 307.0 |
| B | 4 | 172 | 49209 | 155.27 | 1583 | 1542 | 307.0 |
| C | 1 | 16 | 29831 | 79.87 | 1532 | 1539 | 354.2 |
| C | 13 | 61 | 11916 | 29.3 | 1532 | 1539 | 354.2 |
| C | 10 | 22 | 10987 | 26.67 | 1532 | 1539 | 354.2 |
| D | 2 | 63 | 576298 | 1540.14 | 1532 | 1488 | 373.2 |
| D | 5 | 239 | 133956 | 354.93 | 1532 | 1488 | 373.2 |
| D | 2 | 136 | 104488 | 275.98 | 1532 | 1488 | 373.2 |
Histogram calculated using DETX and DETY for each event in the final _common_clean file
| Quadrant A | 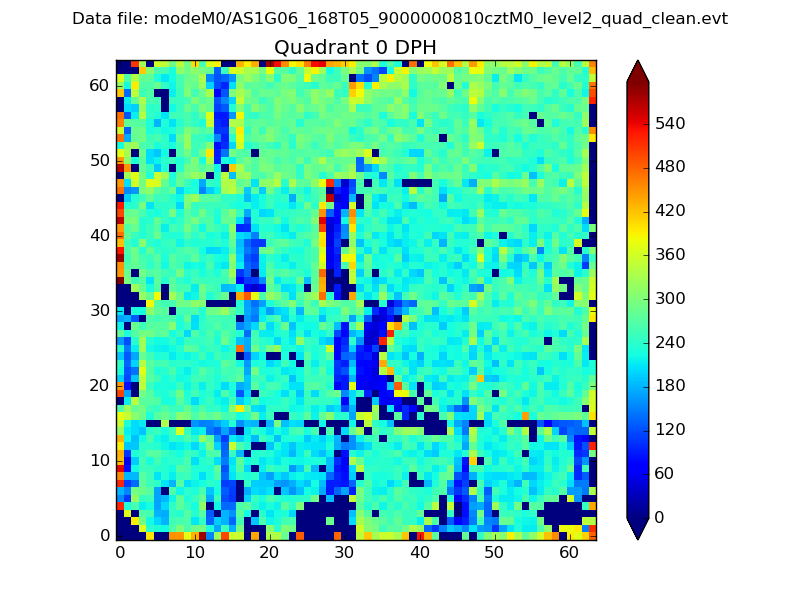 |
 |
Quadrant B |
|---|---|---|---|
| Quadrant D |  |
 |
Quadrant C |
| Plot type | Count rate plots | Images |
|---|---|---|
| Comparison with Poisson distribution Blue bars denote a histogram of data divided into 1 sec bins. Red curve is a Poisson curve with rate = median count rate of data. |
 |
 |
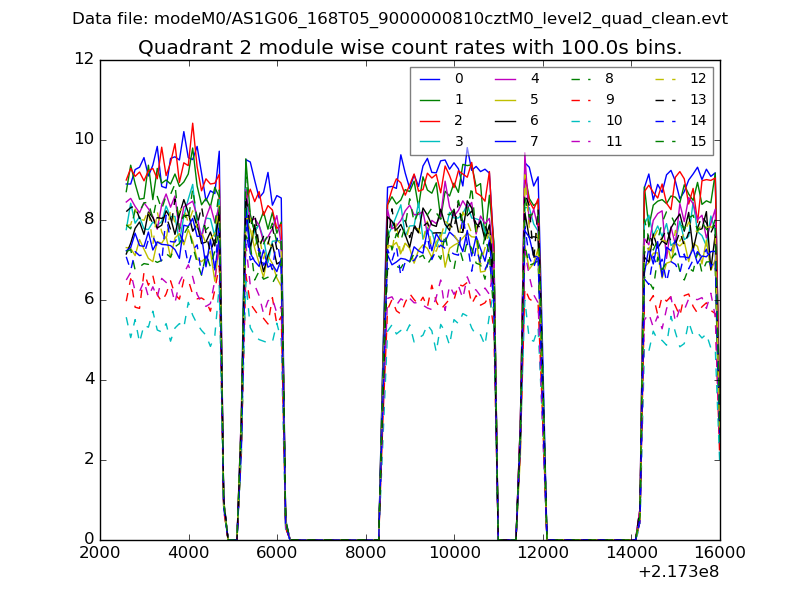
| Quadrant-wise count rates Data is divided into 100 sec bins |
 |
|
| Module-wise count rates for Quadrant A Data is divided into 100 sec bins |
 |
 |
| Module-wise count rates for Quadrant B Data is divided into 100 sec bins |
 |
 |
| Module-wise count rates for Quadrant C Data is divided into 100 sec bins |
 |
 |
| Module-wise count rates for Quadrant D Data is divided into 100 sec bins |
 |
 |
| Parameter | Plot |
|---|---|
| CZT HV Monitor | 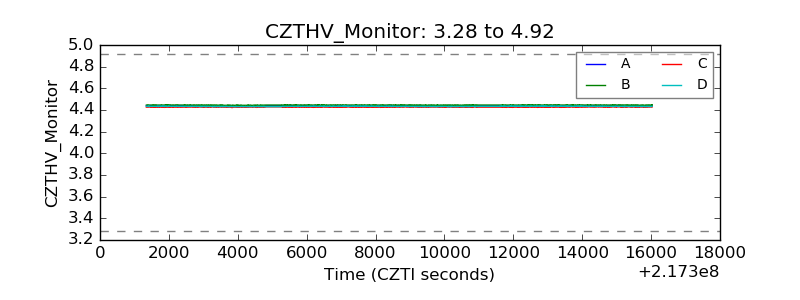 |
| D_VDD |  |
| Temperature 1 |  |
| Veto HV Monitor |  |
| Veto LLD |  |
| Alpha Counter |  |
| _CPM_Rate |  |
| CZT Counter |  |
| +2.5 Volts monitor |  |
| +5 Volts monitor |  |
| _ROLL_ROT |  |
| _Roll_DEC |  |
| _Roll_RA |  |
| Veto Counter |  |