| Param | Original file | Final file |
|---|---|---|
| Filename | modeM0/AS1A02_085T02_9000000808cztM0_level2_bc.evt | modeM0/AS1A02_085T02_9000000808cztM0_level2_quad_clean.evt |
| Size (bytes) | 2,333,868,480 | 961,640,640 |
| Size | 2.2 GB | 917.1 MB |
| Events in quadrant A | 14,657,668 | 6,134,437 |
| Events in quadrant B | 18,688,771 | 6,103,752 |
| Events in quadrant C | 13,794,317 | 6,202,472 |
| Events in quadrant D | 18,802,510 | 5,923,514 |
| Mode SS | |||
|---|---|---|---|
| Quadrant | BADHDUFLAG | Total packets | Discarded packets |
| A | 0 | 1428 | 0 |
| B | 0 | 1422 | 0 |
| C | 0 | 1428 | 0 |
| D | 0 | 1410 | 0 |
| Mode M9 | |||
|---|---|---|---|
| Quadrant | BADHDUFLAG | Total packets | Discarded packets |
| A | 0 | 105 | 0 |
| B | 0 | 105 | 0 |
| C | 0 | 105 | 0 |
| D | 0 | 105 | 0 |
| Mode M0 | |||
|---|---|---|---|
| Quadrant | BADHDUFLAG | Total packets | Discarded packets |
| A | 0 | 146000 | 0 |
| B | 0 | 162796 | 0 |
| C | 0 | 143206 | 0 |
| D | 0 | 159841 | 0 |
| Quadrant | Total seconds | Saturated seconds | Saturation percentage |
|---|---|---|---|
| A | 69502 | 713 | 1.025870% |
| B | 69394 | 2273 | 3.275499% |
| C | 69473 | 518 | 0.745613% |
| D | 69393 | 977 | 1.407923% |
Noise dominated data is calculated using 1-second bins in cleaned event files. If a bin has >2000 counts, and if more than 50% of those come from <1% of pixels, then it is considered to be noise-dominated and hence unusable.
| Quadrant | # 1 sec bins | Bins with >0 counts | Bins with >2000 counts | High rate bins dominated by noise | Noise dominated (total time) | Noise dominated (detector-on time) | Marked lightcurve |
|---|---|---|---|---|---|---|---|
| A | 86645 | 70457 | 4 | 4 | 0.00% | 0.01% |  |
| B | 86645 | 70403 | 109 | 109 | 0.13% | 0.15% | 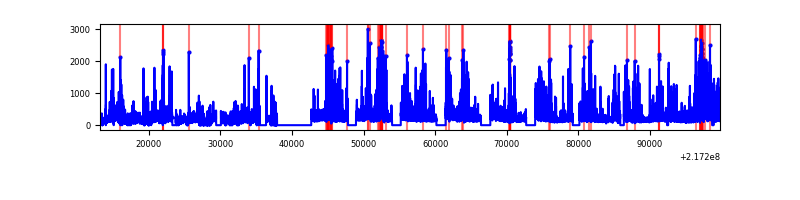 |
| C | 86645 | 70469 | 0 | 0 | 0.00% | 0.00% |  |
| D | 86645 | 70417 | 35 | 35 | 0.04% | 0.05% | 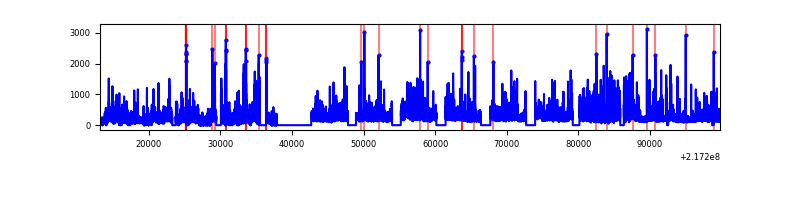 |
Top three noisy pixels from each quadrant. If the there are fewer than three noisy pixels in the level2.evt file, extra rows are filled as -1
| Pixel properties | Quadrant properties | ||||||
|---|---|---|---|---|---|---|---|
| Quadrant | DetID | PixID | Counts | Sigma | Mean | Median | Sigma |
| A | 14 | 111 | 549010 | 726.3 | 3432 | 3363 | 751.3 |
| A | 8 | 15 | 537791 | 711.37 | 3432 | 3363 | 751.3 |
| A | 4 | 2 | 128630 | 166.74 | 3432 | 3363 | 751.3 |
| B | 3 | 64 | 3334572 | 5115.91 | 3420 | 3325 | 651.2 |
| B | 15 | 204 | 490818 | 748.66 | 3420 | 3325 | 651.2 |
| B | 0 | 214 | 409739 | 624.14 | 3420 | 3325 | 651.2 |
| C | 1 | 16 | 394008 | 519.06 | 3393 | 3339 | 752.6 |
| C | 9 | 16 | 41692 | 50.96 | 3393 | 3339 | 752.6 |
| C | 7 | 159 | 33586 | 40.19 | 3393 | 3339 | 752.6 |
| D | 2 | 63 | 2900412 | 3629.55 | 3393 | 3251 | 798.2 |
| D | 2 | 136 | 874948 | 1092.06 | 3393 | 3251 | 798.2 |
| D | 5 | 97 | 539121 | 671.34 | 3393 | 3251 | 798.2 |
Histogram calculated using DETX and DETY for each event in the final _common_clean file
| Quadrant A |  |
 |
Quadrant B |
|---|---|---|---|
| Quadrant D |  |
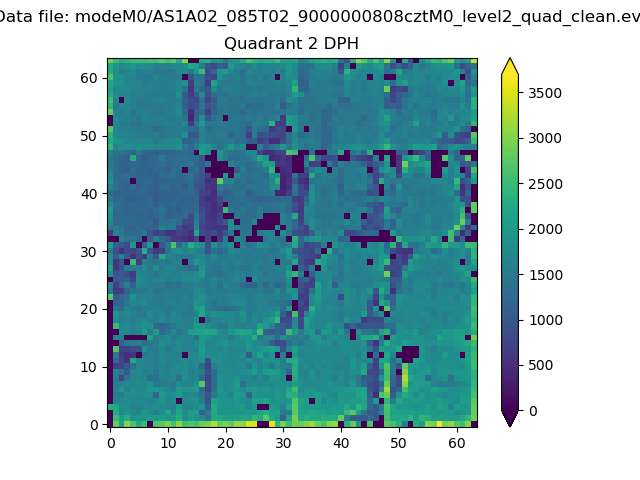 |
Quadrant C |
| Plot type | Count rate plots | Images |
|---|---|---|
| Comparison with Poisson distribution Blue bars denote a histogram of data divided into 1 sec bins. Red curve is a Poisson curve with rate = median count rate of data. |
 |
 |
| Quadrant-wise count rates Data is divided into 100 sec bins |
 |
|
| Module-wise count rates for Quadrant A Data is divided into 100 sec bins |
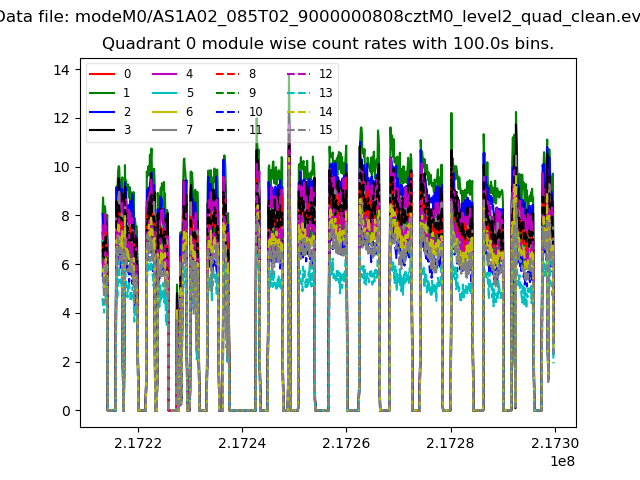 |
 |
| Module-wise count rates for Quadrant B Data is divided into 100 sec bins |
 |
 |
| Module-wise count rates for Quadrant C Data is divided into 100 sec bins |
 |
 |
| Module-wise count rates for Quadrant D Data is divided into 100 sec bins |
 |
 |
| Parameter | Plot |
|---|---|
| CZT HV Monitor |  |
| D_VDD |  |
| Temperature 1 |  |
| Veto HV Monitor |  |
| Veto LLD |  |
| Alpha Counter |  |
| _CPM_Rate | 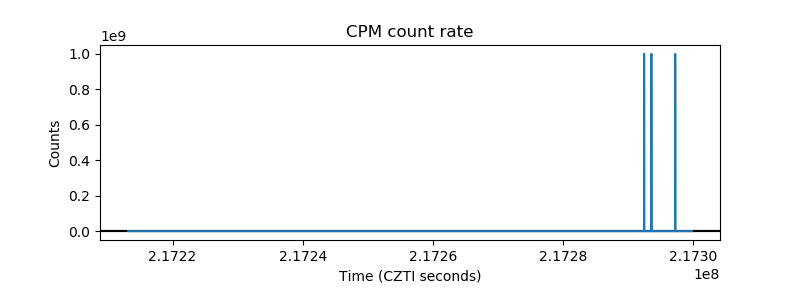 |
| CZT Counter |  |
| +2.5 Volts monitor | 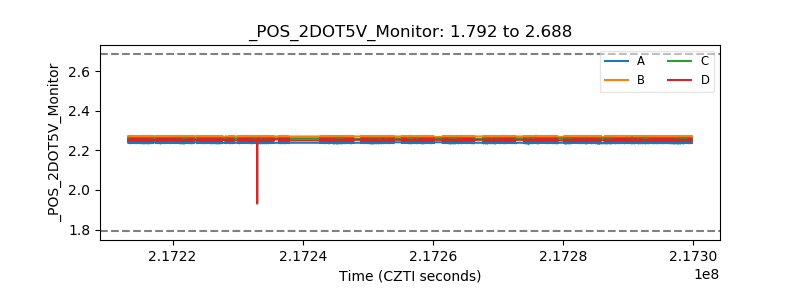 |
| +5 Volts monitor |  |
| _ROLL_ROT | 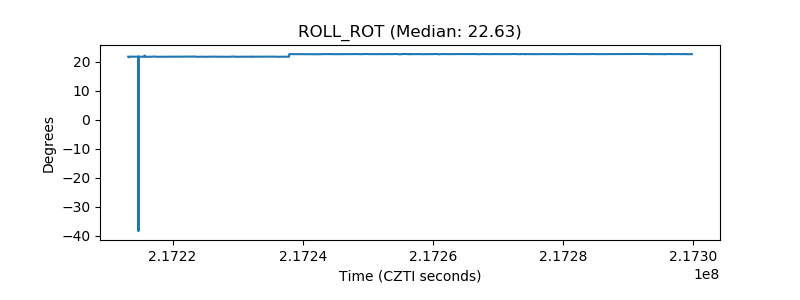 |
| _Roll_DEC | 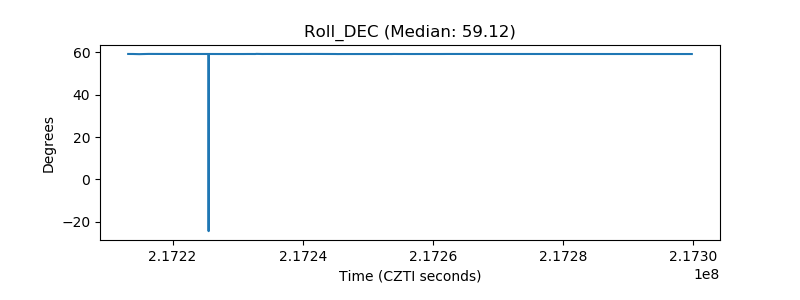 |
| _Roll_RA |  |
| Veto Counter |  |