| Param | Original file | Final file |
|---|---|---|
| Filename | modeM0/AS1A02_152T01_9000000806cztM0_level2_bc.evt | modeM0/AS1A02_152T01_9000000806cztM0_level2_quad_clean.evt |
| Size (bytes) | 878,523,840 | 367,548,480 |
| Size | 837.8 MB | 350.5 MB |
| Events in quadrant A | 6,067,069 | 2,337,298 |
| Events in quadrant B | 6,526,794 | 2,391,137 |
| Events in quadrant C | 5,690,783 | 2,258,298 |
| Events in quadrant D | 6,380,251 | 2,197,013 |
| Mode SS | |||
|---|---|---|---|
| Quadrant | BADHDUFLAG | Total packets | Discarded packets |
| A | 0 | 586 | 0 |
| B | 0 | 584 | 0 |
| C | 0 | 586 | 0 |
| D | 0 | 586 | 0 |
| Mode M0 | |||
|---|---|---|---|
| Quadrant | BADHDUFLAG | Total packets | Discarded packets |
| A | 0 | 60266 | 0 |
| B | 0 | 62236 | 0 |
| C | 0 | 59158 | 0 |
| D | 0 | 61145 | 0 |
| Mode M9 | |||
|---|---|---|---|
| Quadrant | BADHDUFLAG | Total packets | Discarded packets |
| A | 0 | 64 | 0 |
| B | 0 | 65 | 0 |
| C | 0 | 64 | 0 |
| D | 0 | 64 | 0 |
| Quadrant | Total seconds | Saturated seconds | Saturation percentage |
|---|---|---|---|
| A | 28329 | 352 | 1.242543% |
| B | 28354 | 484 | 1.706990% |
| C | 28250 | 211 | 0.746903% |
| D | 28276 | 250 | 0.884142% |
Noise dominated data is calculated using 1-second bins in cleaned event files. If a bin has >2000 counts, and if more than 50% of those come from <1% of pixels, then it is considered to be noise-dominated and hence unusable.
| Quadrant | # 1 sec bins | Bins with >0 counts | Bins with >2000 counts | High rate bins dominated by noise | Noise dominated (total time) | Noise dominated (detector-on time) | Marked lightcurve |
|---|---|---|---|---|---|---|---|
| A | 39721 | 30005 | 5 | 5 | 0.01% | 0.02% |  |
| B | 39721 | 30061 | 12 | 12 | 0.03% | 0.04% |  |
| C | 39721 | 29939 | 5 | 5 | 0.01% | 0.02% | 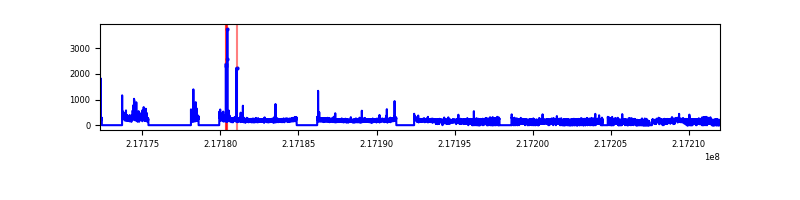 |
| D | 39721 | 30026 | 41 | 41 | 0.10% | 0.14% | 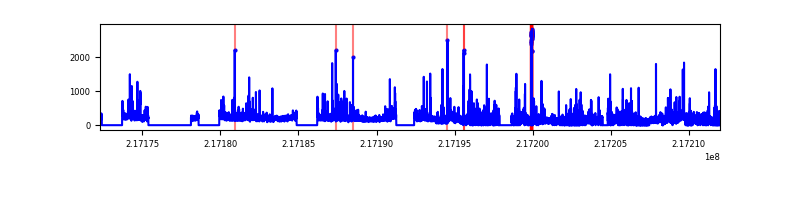 |
Top three noisy pixels from each quadrant. If the there are fewer than three noisy pixels in the level2.evt file, extra rows are filled as -1
| Pixel properties | Quadrant properties | ||||||
|---|---|---|---|---|---|---|---|
| Quadrant | DetID | PixID | Counts | Sigma | Mean | Median | Sigma |
| A | 8 | 15 | 292218 | 920.6 | 1444 | 1414 | 315.9 |
| A | 15 | 234 | 110559 | 345.52 | 1444 | 1414 | 315.9 |
| A | 13 | 251 | 42509 | 130.09 | 1444 | 1414 | 315.9 |
| B | 3 | 64 | 620124 | 2217.57 | 1471 | 1431 | 279.0 |
| B | 4 | 80 | 95082 | 335.67 | 1471 | 1431 | 279.0 |
| B | 15 | 204 | 61677 | 215.94 | 1471 | 1431 | 279.0 |
| C | 12 | 16 | 147783 | 475.43 | 1399 | 1375 | 307.9 |
| C | 1 | 16 | 42168 | 132.47 | 1399 | 1375 | 307.9 |
| C | 9 | 16 | 11481 | 32.82 | 1399 | 1375 | 307.9 |
| D | 2 | 136 | 503249 | 1550.33 | 1407 | 1353 | 323.7 |
| D | 8 | 195 | 124178 | 379.4 | 1407 | 1353 | 323.7 |
| D | 10 | 172 | 122113 | 373.02 | 1407 | 1353 | 323.7 |
Histogram calculated using DETX and DETY for each event in the final _common_clean file
| Quadrant A | 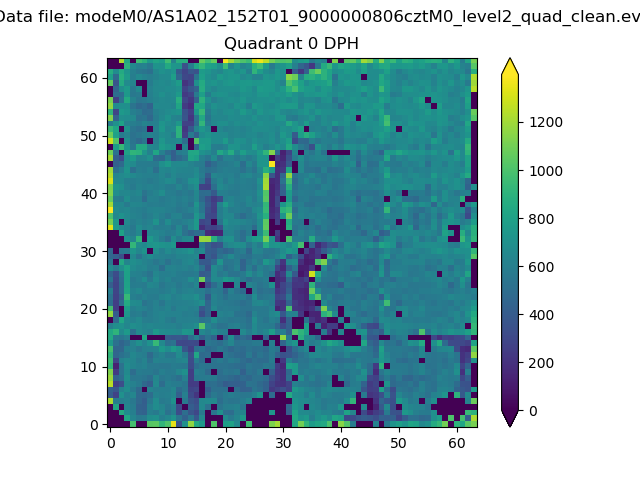 |
 |
Quadrant B |
|---|---|---|---|
| Quadrant D |  |
 |
Quadrant C |
| Plot type | Count rate plots | Images |
|---|---|---|
| Comparison with Poisson distribution Blue bars denote a histogram of data divided into 1 sec bins. Red curve is a Poisson curve with rate = median count rate of data. |
 |
 |
| Quadrant-wise count rates Data is divided into 100 sec bins |
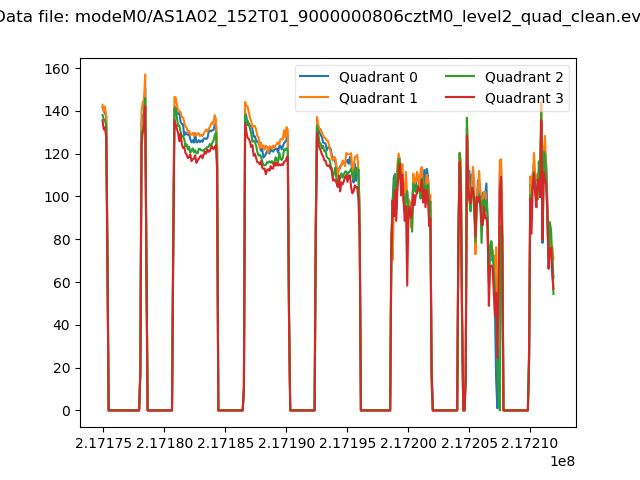 |
|
| Module-wise count rates for Quadrant A Data is divided into 100 sec bins |
 |
 |
| Module-wise count rates for Quadrant B Data is divided into 100 sec bins |
 |
 |
| Module-wise count rates for Quadrant C Data is divided into 100 sec bins |
 |
 |
| Module-wise count rates for Quadrant D Data is divided into 100 sec bins |
 |
 |
| Parameter | Plot |
|---|---|
| CZT HV Monitor | 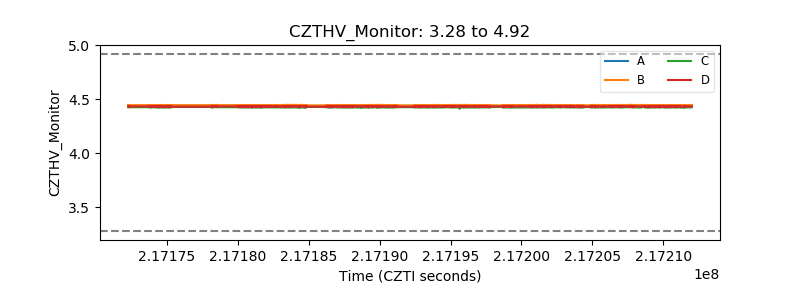 |
| D_VDD |  |
| Temperature 1 |  |
| Veto HV Monitor |  |
| Veto LLD | 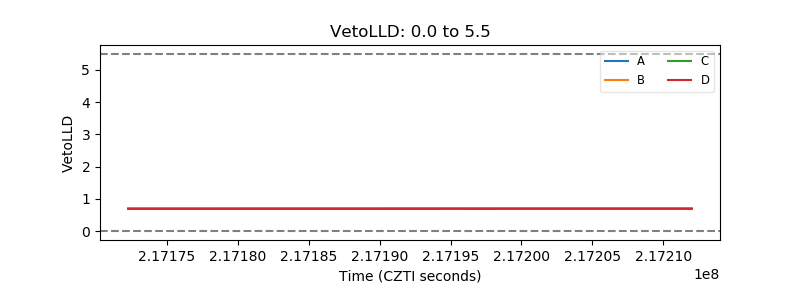 |
| Alpha Counter |  |
| _CPM_Rate |  |
| CZT Counter |  |
| +2.5 Volts monitor |  |
| +5 Volts monitor |  |
| _ROLL_ROT |  |
| _Roll_DEC |  |
| _Roll_RA |  |
| Veto Counter |  |