| Param | Original file | Final file |
|---|---|---|
| Filename | modeM0/AS1G06_139T05_9000000804cztM0_level2.evt | modeM0/AS1G06_139T05_9000000804cztM0_level2_quad_clean.evt |
| Size (bytes) | 2,526,641,280 | 515,301,120 |
| Size | 2.4 GB | 491.4 MB |
| Events in quadrant A | 19,547,299 | 4,000,184 |
| Events in quadrant B | 19,554,379 | 3,083,788 |
| Events in quadrant C | 17,160,008 | 3,049,204 |
| Events in quadrant D | 17,760,166 | 2,938,000 |
| Mode SS | |||
|---|---|---|---|
| Quadrant | BADHDUFLAG | Total packets | Discarded packets |
| A | 0 | 748 | 0 |
| B | 0 | 764 | 0 |
| C | 0 | 754 | 0 |
| D | 0 | 750 | 0 |
| Mode M0 | |||
|---|---|---|---|
| Quadrant | BADHDUFLAG | Total packets | Discarded packets |
| A | 0 | 82417 | 0 |
| B | 0 | 82848 | 0 |
| C | 0 | 77296 | 0 |
| D | 0 | 79281 | 0 |
| Mode M9 | |||
|---|---|---|---|
| Quadrant | BADHDUFLAG | Total packets | Discarded packets |
| A | 0 | 53 | 0 |
| B | 0 | 52 | 0 |
| C | 0 | 51 | 0 |
| D | 0 | 53 | 0 |
| Quadrant | Total seconds | Saturated seconds | Saturation percentage |
|---|---|---|---|
| A | 36781 | 473 | 1.285990% |
| B | 36888 | 922 | 2.499458% |
| C | 37006 | 321 | 0.867427% |
| D | 36927 | 414 | 1.121131% |
Noise dominated data is calculated using 1-second bins in cleaned event files. If a bin has >2000 counts, and if more than 50% of those come from <1% of pixels, then it is considered to be noise-dominated and hence unusable.
| Quadrant | # 1 sec bins | Bins with >0 counts | Bins with >2000 counts | High rate bins dominated by noise | Noise dominated (total time) | Noise dominated (detector-on time) | Marked lightcurve |
|---|---|---|---|---|---|---|---|
| A | 57659 | 38788 | 32 | 32 | 0.06% | 0.08% |  |
| B | 57659 | 38961 | 406 | 406 | 0.70% | 1.04% |  |
| C | 57659 | 39076 | 35 | 35 | 0.06% | 0.09% |  |
| D | 57659 | 39003 | 120 | 120 | 0.21% | 0.31% |  |
Top three noisy pixels from each quadrant. If the there are fewer than three noisy pixels in the level2.evt file, extra rows are filled as -1
| Pixel properties | Quadrant properties | ||||||
|---|---|---|---|---|---|---|---|
| Quadrant | DetID | PixID | Counts | Sigma | Mean | Median | Sigma |
| A | 13 | 34 | 1545742 | 1789.93 | 4283 | 4190 | 861.2 |
| A | 8 | 15 | 1065892 | 1232.76 | 4283 | 4190 | 861.2 |
| A | 15 | 234 | 288683 | 330.33 | 4283 | 4190 | 861.2 |
| B | 3 | 64 | 2129213 | 2571.48 | 4322 | 4214 | 826.4 |
| B | 0 | 219 | 266061 | 316.86 | 4322 | 4214 | 826.4 |
| B | 15 | 35 | 121830 | 142.33 | 4322 | 4214 | 826.4 |
| C | 12 | 16 | 720933 | 745.44 | 4180 | 4199 | 961.5 |
| C | 9 | 16 | 70838 | 69.31 | 4180 | 4199 | 961.5 |
| C | 1 | 16 | 41419 | 38.71 | 4180 | 4199 | 961.5 |
| D | 2 | 136 | 578398 | 562.0 | 4171 | 4045 | 1022.0 |
| D | 12 | 110 | 366284 | 354.45 | 4171 | 4045 | 1022.0 |
| D | 2 | 206 | 326658 | 315.67 | 4171 | 4045 | 1022.0 |
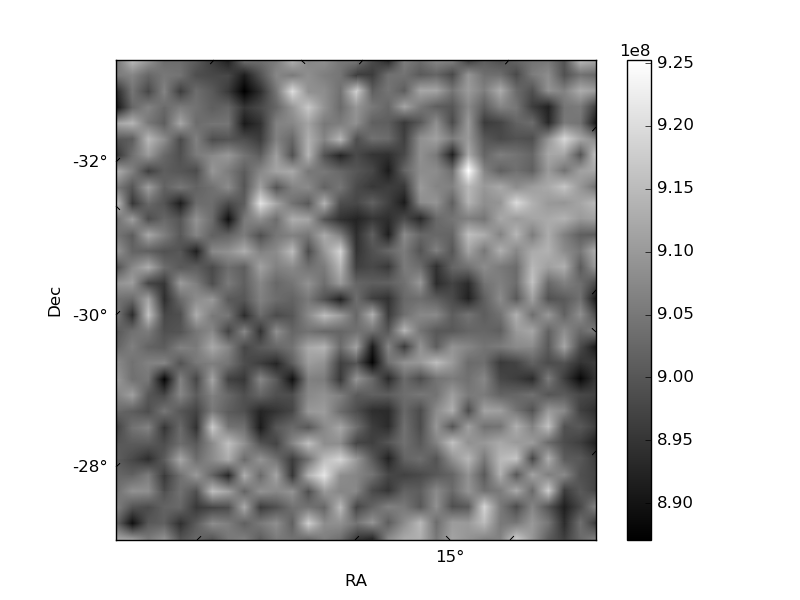
Histogram calculated using DETX and DETY for each event in the final _common_clean file
| Quadrant A |  |
 |
Quadrant B |
|---|---|---|---|
| Quadrant D |  |
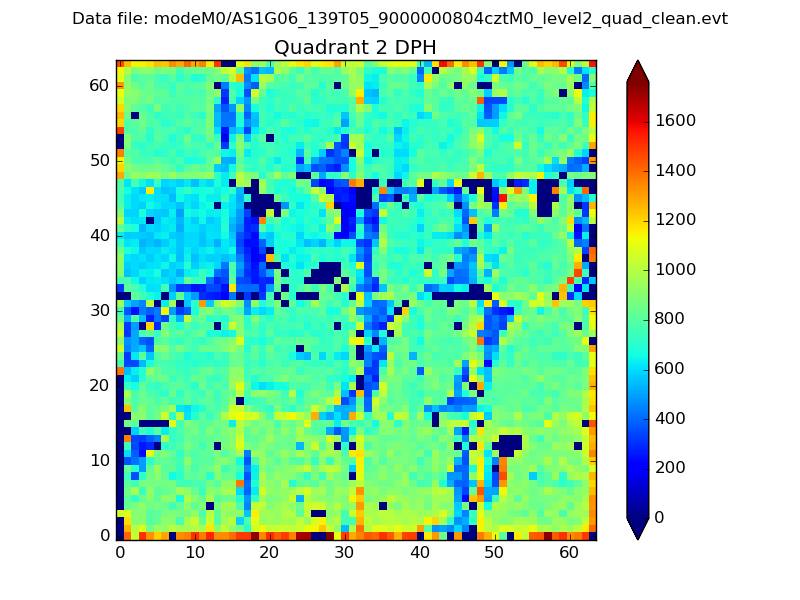 |
Quadrant C |
| Plot type | Count rate plots | Images |
|---|---|---|
| Comparison with Poisson distribution Blue bars denote a histogram of data divided into 1 sec bins. Red curve is a Poisson curve with rate = median count rate of data. |
 |
 |
| Quadrant-wise count rates Data is divided into 100 sec bins |
 |
|
| Module-wise count rates for Quadrant A Data is divided into 100 sec bins |
 |
 |
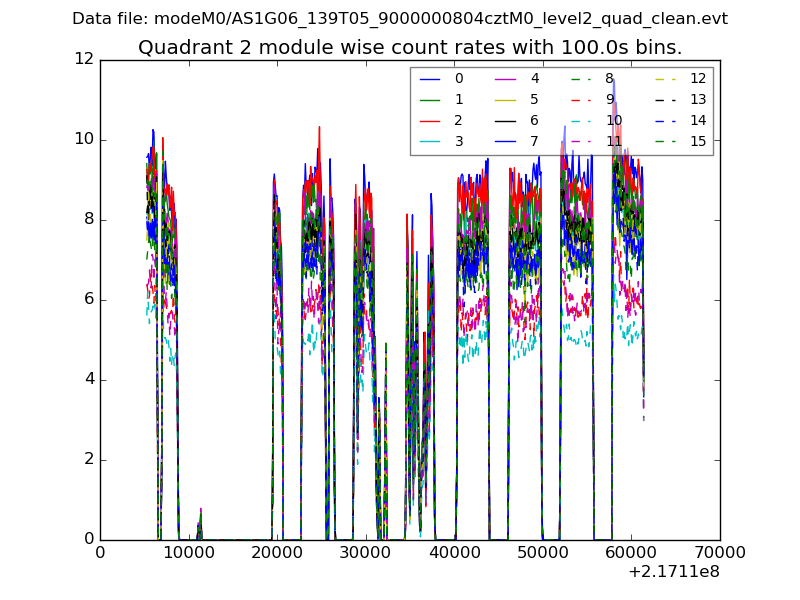
| Module-wise count rates for Quadrant B Data is divided into 100 sec bins |
 |
 |
| Module-wise count rates for Quadrant C Data is divided into 100 sec bins |
 |
 |
| Module-wise count rates for Quadrant D Data is divided into 100 sec bins |
 |
 |
| Parameter | Plot |
|---|---|
| CZT HV Monitor | 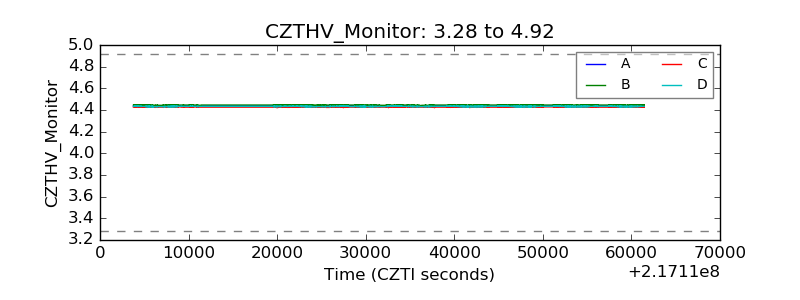 |
| D_VDD | 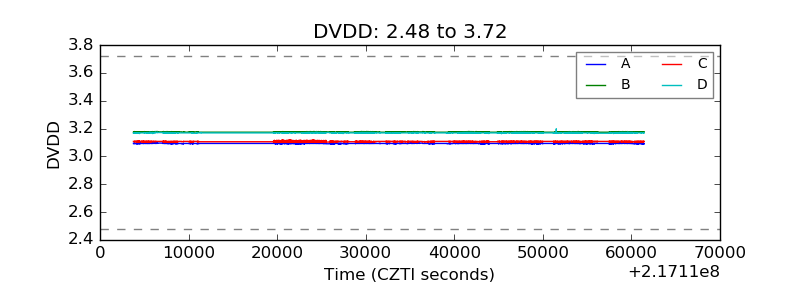 |
| Temperature 1 |  |
| Veto HV Monitor |  |
| Veto LLD |  |
| Alpha Counter |  |
| _CPM_Rate |  |
| CZT Counter |  |
| +2.5 Volts monitor |  |
| +5 Volts monitor |  |
| _ROLL_ROT | 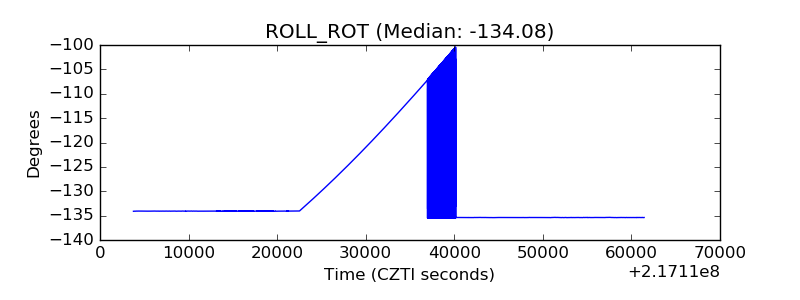 |
| _Roll_DEC | 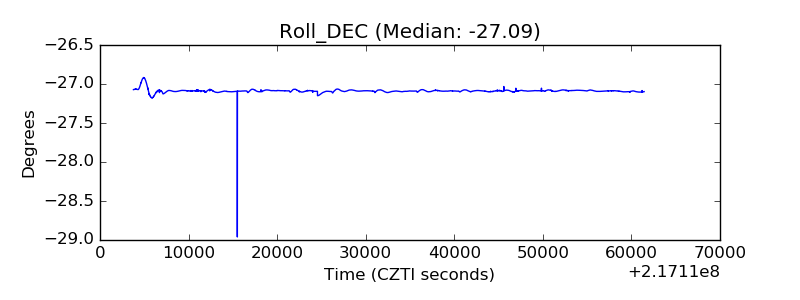 |
| _Roll_RA |  |
| Veto Counter |  |