| Param | Original file | Final file |
|---|---|---|
| Filename | modeM0/AS1A02_006T01_9000000802cztM0_level2.evt | modeM0/AS1A02_006T01_9000000802cztM0_level2_quad_clean.evt |
| Size (bytes) | 2,932,511,040 | 659,701,440 |
| Size | 2.7 GB | 629.1 MB |
| Events in quadrant A | 21,595,661 | 4,272,250 |
| Events in quadrant B | 22,699,845 | 4,331,472 |
| Events in quadrant C | 20,621,801 | 4,232,024 |
| Events in quadrant D | 20,874,223 | 4,080,655 |
| Mode M9 | |||
|---|---|---|---|
| Quadrant | BADHDUFLAG | Total packets | Discarded packets |
| A | 0 | 99 | 0 |
| B | 0 | 98 | 0 |
| C | 0 | 100 | 0 |
| D | 0 | 96 | 0 |
| Mode SS | |||
|---|---|---|---|
| Quadrant | BADHDUFLAG | Total packets | Discarded packets |
| A | 0 | 922 | 0 |
| B | 0 | 925 | 0 |
| C | 0 | 904 | 0 |
| D | 0 | 920 | 0 |
| Mode M0 | |||
|---|---|---|---|
| Quadrant | BADHDUFLAG | Total packets | Discarded packets |
| A | 0 | 94386 | 0 |
| B | 0 | 97394 | 0 |
| C | 0 | 93170 | 0 |
| D | 0 | 94878 | 0 |
| Quadrant | Total seconds | Saturated seconds | Saturation percentage |
|---|---|---|---|
| A | 44652 | 550 | 1.231748% |
| B | 44569 | 753 | 1.689515% |
| C | 44667 | 389 | 0.870889% |
| D | 44655 | 521 | 1.166723% |
Noise dominated data is calculated using 1-second bins in cleaned event files. If a bin has >2000 counts, and if more than 50% of those come from <1% of pixels, then it is considered to be noise-dominated and hence unusable.
| Quadrant | # 1 sec bins | Bins with >0 counts | Bins with >2000 counts | High rate bins dominated by noise | Noise dominated (total time) | Noise dominated (detector-on time) | Marked lightcurve |
|---|---|---|---|---|---|---|---|
| A | 59499 | 46146 | 31 | 31 | 0.05% | 0.07% |  |
| B | 59521 | 46075 | 179 | 179 | 0.30% | 0.39% |  |
| C | 59488 | 46182 | 40 | 40 | 0.07% | 0.09% | 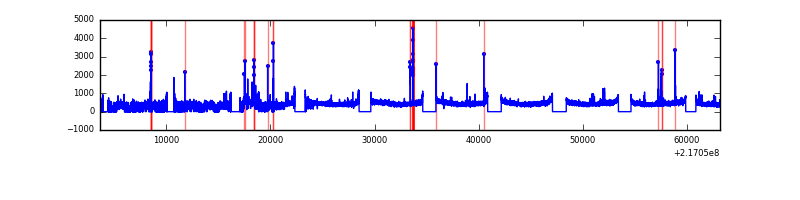 |
| D | 59489 | 46139 | 134 | 134 | 0.23% | 0.29% |  |
Top three noisy pixels from each quadrant. If the there are fewer than three noisy pixels in the level2.evt file, extra rows are filled as -1
| Pixel properties | Quadrant properties | ||||||
|---|---|---|---|---|---|---|---|
| Quadrant | DetID | PixID | Counts | Sigma | Mean | Median | Sigma |
| A | 8 | 15 | 1036127 | 980.2 | 5241 | 5139 | 1051.8 |
| A | 4 | 2 | 158560 | 145.86 | 5241 | 5139 | 1051.8 |
| A | 13 | 251 | 124098 | 113.1 | 5241 | 5139 | 1051.8 |
| B | 3 | 64 | 1185873 | 1187.28 | 5284 | 5157 | 994.5 |
| B | 0 | 219 | 638278 | 636.64 | 5284 | 5157 | 994.5 |
| B | 4 | 81 | 166629 | 162.37 | 5284 | 5157 | 994.5 |
| C | 12 | 16 | 379549 | 321.08 | 5093 | 5131 | 1166.1 |
| C | 1 | 16 | 276100 | 232.37 | 5093 | 5131 | 1166.1 |
| C | 9 | 16 | 43981 | 33.32 | 5093 | 5131 | 1166.1 |
| D | 13 | 169 | 525267 | 422.41 | 5071 | 4917 | 1231.8 |
| D | 5 | 97 | 260861 | 207.77 | 5071 | 4917 | 1231.8 |
| D | 8 | 195 | 219504 | 174.2 | 5071 | 4917 | 1231.8 |
Histogram calculated using DETX and DETY for each event in the final _common_clean file
| Quadrant A |  |
 |
Quadrant B |
|---|---|---|---|
| Quadrant D |  |
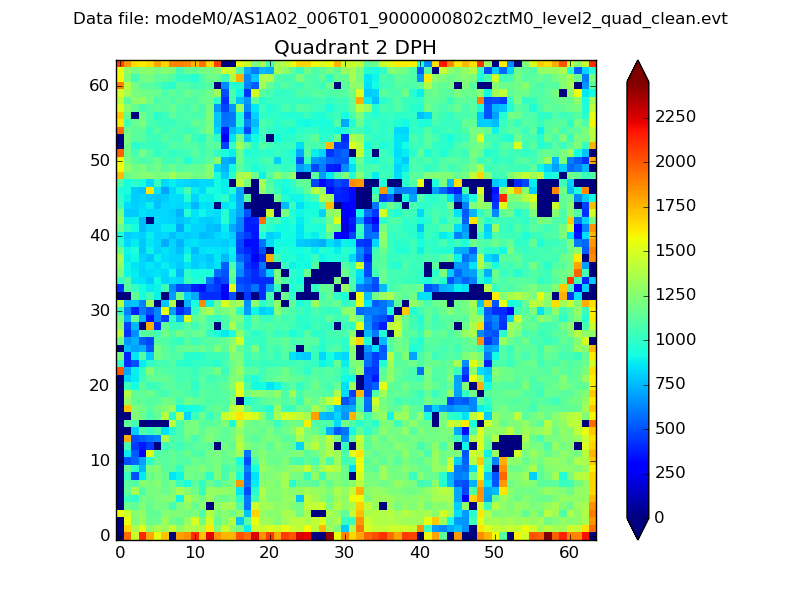 |
Quadrant C |
| Plot type | Count rate plots | Images |
|---|---|---|
| Comparison with Poisson distribution Blue bars denote a histogram of data divided into 1 sec bins. Red curve is a Poisson curve with rate = median count rate of data. |
 |
 |
| Quadrant-wise count rates Data is divided into 100 sec bins |
 |
|
| Module-wise count rates for Quadrant A Data is divided into 100 sec bins |
 |
 |
| Module-wise count rates for Quadrant B Data is divided into 100 sec bins |
 |
 |
| Module-wise count rates for Quadrant C Data is divided into 100 sec bins |
 |
 |
| Module-wise count rates for Quadrant D Data is divided into 100 sec bins |
 |
 |
| Parameter | Plot |
|---|---|
| CZT HV Monitor |  |
| D_VDD |  |
| Temperature 1 |  |
| Veto HV Monitor |  |
| Veto LLD |  |
| Alpha Counter |  |
| _CPM_Rate |  |
| CZT Counter | 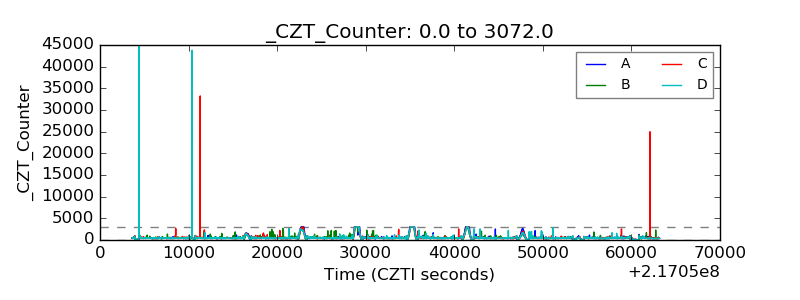 |
| +2.5 Volts monitor |  |
| +5 Volts monitor |  |
| _ROLL_ROT |  |
| _Roll_DEC |  |
| _Roll_RA | 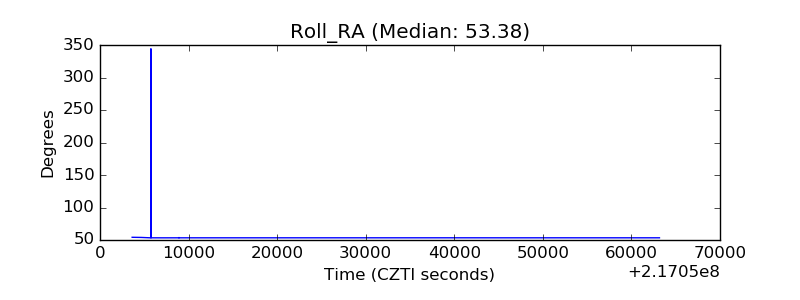 |
| Veto Counter |  |