| Param | Original file | Final file |
|---|---|---|
| Filename | modeM0/AS1A02_199T01_9000000800cztM0_level2.evt | modeM0/AS1A02_199T01_9000000800cztM0_level2_quad_clean.evt |
| Size (bytes) | 3,546,316,800 | 772,133,760 |
| Size | 3.3 GB | 736.4 MB |
| Events in quadrant A | 24,281,499 | 5,054,745 |
| Events in quadrant B | 28,893,297 | 5,057,067 |
| Events in quadrant C | 23,351,586 | 4,971,754 |
| Events in quadrant D | 27,324,017 | 4,697,523 |
| Mode M0 | |||
|---|---|---|---|
| Quadrant | BADHDUFLAG | Total packets | Discarded packets |
| A | 0 | 109328 | 0 |
| B | 0 | 122068 | 0 |
| C | 0 | 107535 | 0 |
| D | 0 | 119846 | 0 |
| Mode SS | |||
|---|---|---|---|
| Quadrant | BADHDUFLAG | Total packets | Discarded packets |
| A | 0 | 1070 | 0 |
| B | 0 | 1070 | 0 |
| C | 0 | 1070 | 0 |
| D | 0 | 1070 | 0 |
| Mode M9 | |||
|---|---|---|---|
| Quadrant | BADHDUFLAG | Total packets | Discarded packets |
| A | 0 | 74 | 0 |
| B | 0 | 74 | 0 |
| C | 0 | 74 | 0 |
| D | 0 | 75 | 0 |
| Quadrant | Total seconds | Saturated seconds | Saturation percentage |
|---|---|---|---|
| A | 52568 | 405 | 0.770431% |
| B | 52569 | 1256 | 2.389241% |
| C | 52569 | 231 | 0.439422% |
| D | 52572 | 1134 | 2.157042% |
Noise dominated data is calculated using 1-second bins in cleaned event files. If a bin has >2000 counts, and if more than 50% of those come from <1% of pixels, then it is considered to be noise-dominated and hence unusable.
| Quadrant | # 1 sec bins | Bins with >0 counts | Bins with >2000 counts | High rate bins dominated by noise | Noise dominated (total time) | Noise dominated (detector-on time) | Marked lightcurve |
|---|---|---|---|---|---|---|---|
| A | 61536 | 52598 | 91 | 91 | 0.15% | 0.17% |  |
| B | 61536 | 52597 | 621 | 621 | 1.01% | 1.18% |  |
| C | 61536 | 52599 | 3 | 3 | 0.00% | 0.01% | 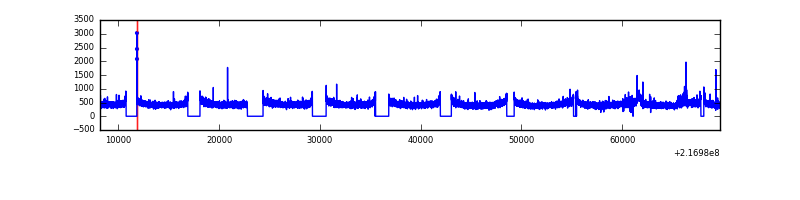 |
| D | 61536 | 52598 | 725 | 725 | 1.18% | 1.38% |  |
Top three noisy pixels from each quadrant. If the there are fewer than three noisy pixels in the level2.evt file, extra rows are filled as -1
| Pixel properties | Quadrant properties | ||||||
|---|---|---|---|---|---|---|---|
| Quadrant | DetID | PixID | Counts | Sigma | Mean | Median | Sigma |
| A | 8 | 15 | 831618 | 687.49 | 6007 | 5877 | 1201.1 |
| A | 0 | 254 | 106313 | 83.62 | 6007 | 5877 | 1201.1 |
| A | 15 | 236 | 102529 | 80.47 | 6007 | 5877 | 1201.1 |
| B | 3 | 64 | 3892052 | 3449.7 | 6032 | 5887 | 1126.5 |
| B | 0 | 219 | 686093 | 603.81 | 6032 | 5887 | 1126.5 |
| B | 0 | 214 | 305264 | 265.75 | 6032 | 5887 | 1126.5 |
| C | 1 | 16 | 259449 | 188.44 | 5892 | 5918 | 1345.5 |
| C | 13 | 61 | 47072 | 30.59 | 5892 | 5918 | 1345.5 |
| C | 9 | 16 | 38533 | 24.24 | 5892 | 5918 | 1345.5 |
| D | 13 | 169 | 3590877 | 2563.0 | 5810 | 5644 | 1398.8 |
| D | 2 | 33 | 530025 | 374.87 | 5810 | 5644 | 1398.8 |
| D | 5 | 97 | 435576 | 307.35 | 5810 | 5644 | 1398.8 |
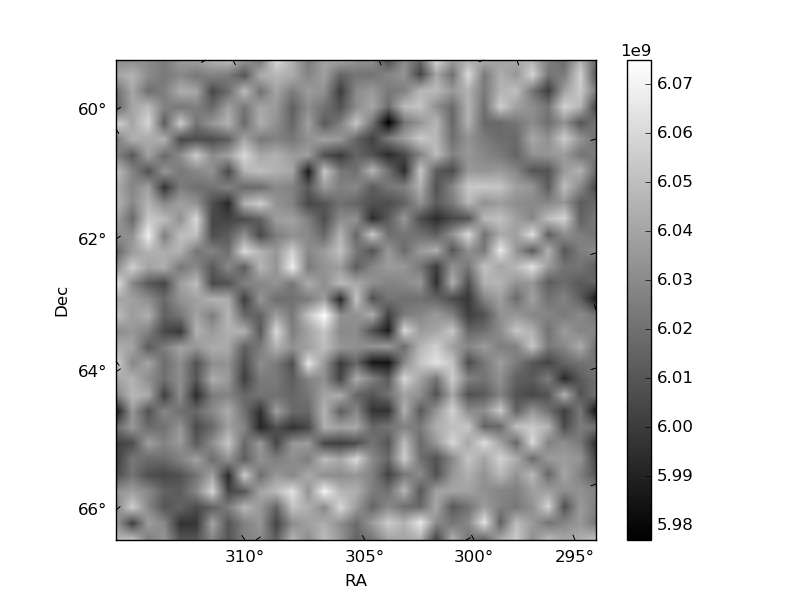
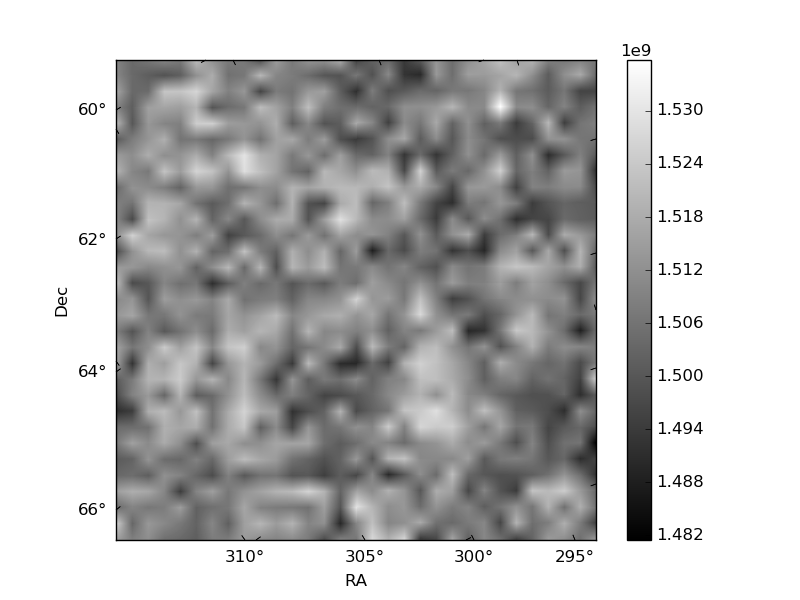
Histogram calculated using DETX and DETY for each event in the final _common_clean file
| Quadrant A |  |
 |
Quadrant B |
|---|---|---|---|
| Quadrant D |  |
 |
Quadrant C |
| Plot type | Count rate plots | Images |
|---|---|---|
| Comparison with Poisson distribution Blue bars denote a histogram of data divided into 1 sec bins. Red curve is a Poisson curve with rate = median count rate of data. |
 |
 |
| Quadrant-wise count rates Data is divided into 100 sec bins |
 |
|
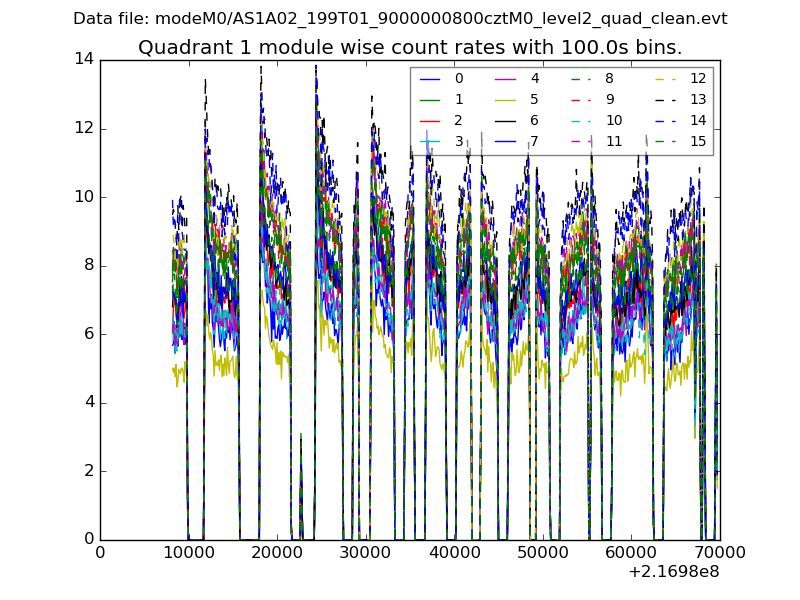
| Module-wise count rates for Quadrant A Data is divided into 100 sec bins |
 |
 |
| Module-wise count rates for Quadrant B Data is divided into 100 sec bins |
 |
 |
| Module-wise count rates for Quadrant C Data is divided into 100 sec bins |
 |
 |
| Module-wise count rates for Quadrant D Data is divided into 100 sec bins |
 |
 |
| Parameter | Plot |
|---|---|
| CZT HV Monitor |  |
| D_VDD |  |
| Temperature 1 |  |
| Veto HV Monitor |  |
| Veto LLD |  |
| Alpha Counter |  |
| _CPM_Rate |  |
| CZT Counter |  |
| +2.5 Volts monitor |  |
| +5 Volts monitor |  |
| _ROLL_ROT |  |
| _Roll_DEC |  |
| _Roll_RA | 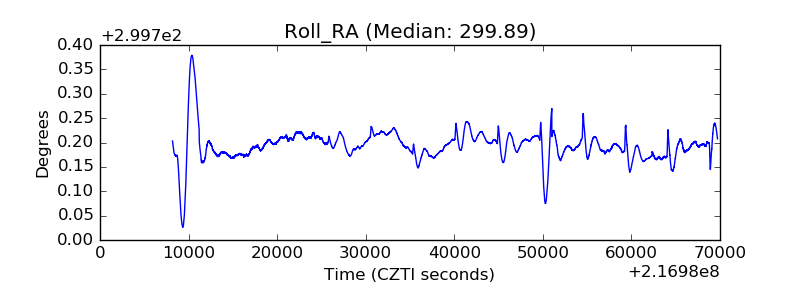 |
| Veto Counter |  |