| Param | Original file | Final file |
|---|---|---|
| Filename | modeM0/AS1C02_018T01_9000000798cztM0_level2.evt | modeM0/AS1C02_018T01_9000000798cztM0_level2_quad_clean.evt |
| Size (bytes) | 3,514,582,080 | 603,679,680 |
| Size | 3.3 GB | 575.7 MB |
| Events in quadrant A | 25,867,245 | 3,672,742 |
| Events in quadrant B | 30,024,228 | 3,671,969 |
| Events in quadrant C | 22,901,932 | 3,847,665 |
| Events in quadrant D | 24,271,080 | 3,661,917 |
| Mode M9 | |||
|---|---|---|---|
| Quadrant | BADHDUFLAG | Total packets | Discarded packets |
| A | 0 | 52 | 0 |
| B | 0 | 50 | 0 |
| C | 0 | 52 | 0 |
| D | 0 | 51 | 0 |
| Mode M0 | |||
|---|---|---|---|
| Quadrant | BADHDUFLAG | Total packets | Discarded packets |
| A | 0 | 110338 | 0 |
| B | 0 | 122171 | 0 |
| C | 0 | 103456 | 0 |
| D | 0 | 108317 | 0 |
| Mode SS | |||
|---|---|---|---|
| Quadrant | BADHDUFLAG | Total packets | Discarded packets |
| A | 0 | 1016 | 0 |
| B | 0 | 1014 | 0 |
| C | 0 | 1010 | 0 |
| D | 0 | 1018 | 0 |
| Quadrant | Total seconds | Saturated seconds | Saturation percentage |
|---|---|---|---|
| A | 49971 | 1175 | 2.351364% |
| B | 49883 | 2405 | 4.821282% |
| C | 50017 | 670 | 1.339545% |
| D | 50012 | 1039 | 2.077501% |
Noise dominated data is calculated using 1-second bins in cleaned event files. If a bin has >2000 counts, and if more than 50% of those come from <1% of pixels, then it is considered to be noise-dominated and hence unusable.
| Quadrant | # 1 sec bins | Bins with >0 counts | Bins with >2000 counts | High rate bins dominated by noise | Noise dominated (total time) | Noise dominated (detector-on time) | Marked lightcurve |
|---|---|---|---|---|---|---|---|
| A | 55945 | 50513 | 240 | 240 | 0.43% | 0.48% |  |
| B | 55945 | 50467 | 929 | 929 | 1.66% | 1.84% |  |
| C | 55945 | 50532 | 2 | 2 | 0.00% | 0.00% |  |
| D | 55945 | 50533 | 275 | 275 | 0.49% | 0.54% |  |
Top three noisy pixels from each quadrant. If the there are fewer than three noisy pixels in the level2.evt file, extra rows are filled as -1
| Pixel properties | Quadrant properties | ||||||
|---|---|---|---|---|---|---|---|
| Quadrant | DetID | PixID | Counts | Sigma | Mean | Median | Sigma |
| A | 8 | 15 | 1806948 | 1492.4 | 5919 | 5793 | 1206.9 |
| A | 13 | 170 | 839822 | 691.06 | 5919 | 5793 | 1206.9 |
| A | 4 | 2 | 173068 | 138.6 | 5919 | 5793 | 1206.9 |
| B | 3 | 64 | 4675086 | 4137.18 | 5896 | 5752 | 1128.6 |
| B | 0 | 219 | 1240910 | 1094.39 | 5896 | 5752 | 1128.6 |
| B | 0 | 214 | 370439 | 323.12 | 5896 | 5752 | 1128.6 |
| C | 1 | 16 | 119547 | 84.6 | 5801 | 5832 | 1344.2 |
| C | 9 | 16 | 72279 | 49.43 | 5801 | 5832 | 1344.2 |
| C | 13 | 61 | 46045 | 29.92 | 5801 | 5832 | 1344.2 |
| D | 13 | 169 | 1096059 | 769.17 | 5785 | 5611 | 1417.7 |
| D | 5 | 97 | 320232 | 221.93 | 5785 | 5611 | 1417.7 |
| D | 2 | 33 | 292532 | 202.39 | 5785 | 5611 | 1417.7 |
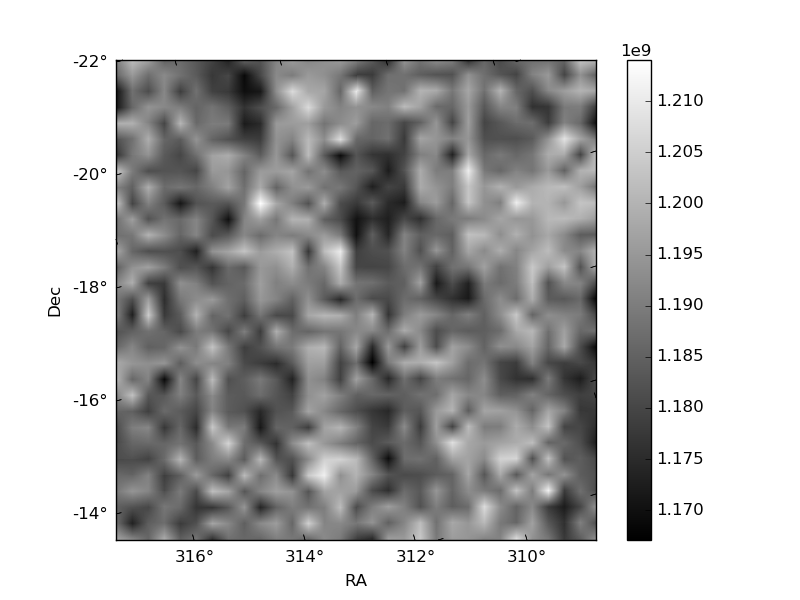
Histogram calculated using DETX and DETY for each event in the final _common_clean file
| Quadrant A | 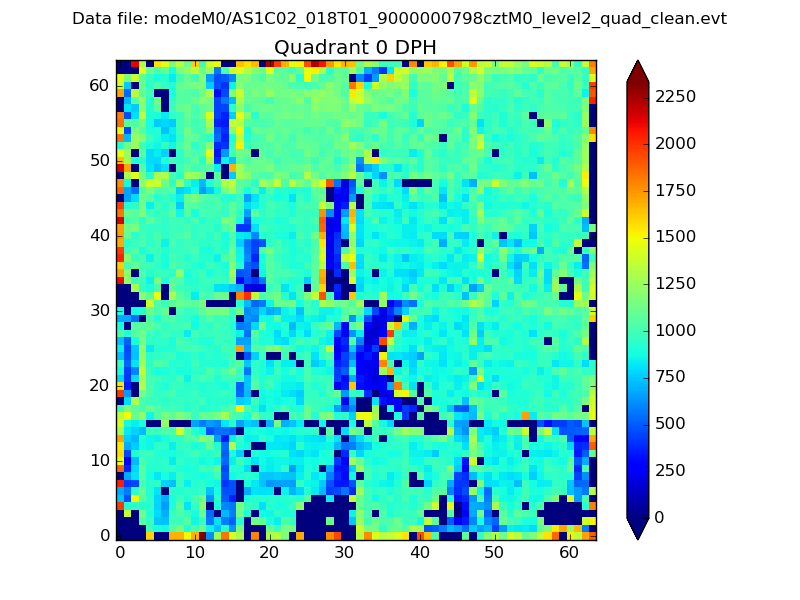 |
 |
Quadrant B |
|---|---|---|---|
| Quadrant D |  |
 |
Quadrant C |
| Plot type | Count rate plots | Images |
|---|---|---|
| Comparison with Poisson distribution Blue bars denote a histogram of data divided into 1 sec bins. Red curve is a Poisson curve with rate = median count rate of data. |
 |
 |
| Quadrant-wise count rates Data is divided into 100 sec bins |
 |
|
| Module-wise count rates for Quadrant A Data is divided into 100 sec bins |
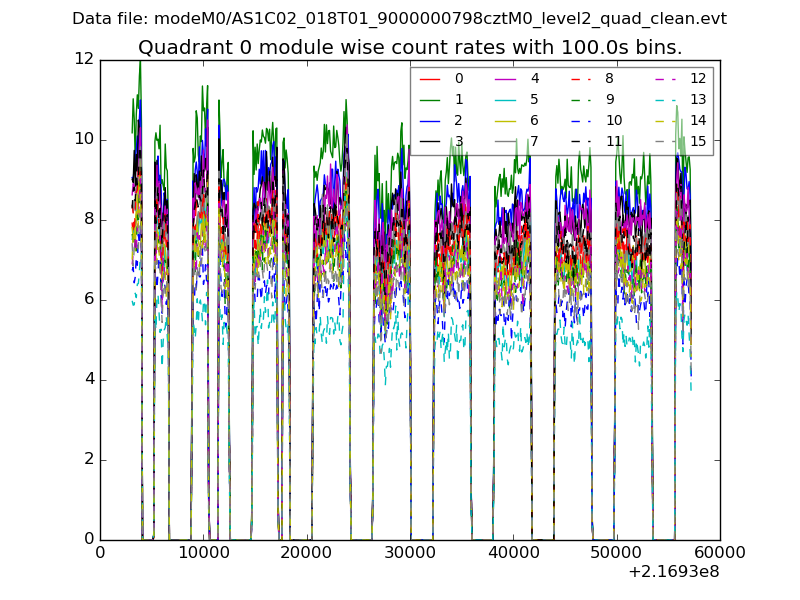 |
 |
| Module-wise count rates for Quadrant B Data is divided into 100 sec bins |
 |
 |
| Module-wise count rates for Quadrant C Data is divided into 100 sec bins |
 |
 |
| Module-wise count rates for Quadrant D Data is divided into 100 sec bins |
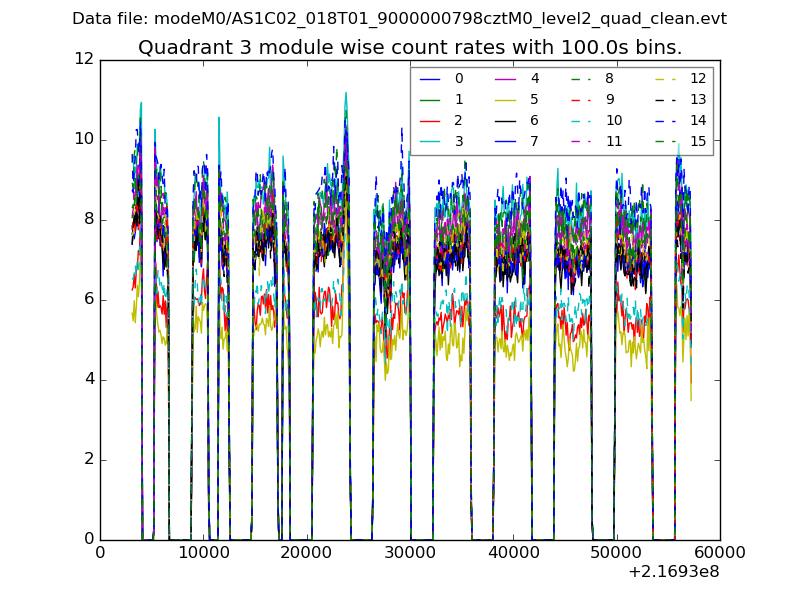 |
 |
| Parameter | Plot |
|---|---|
| CZT HV Monitor | 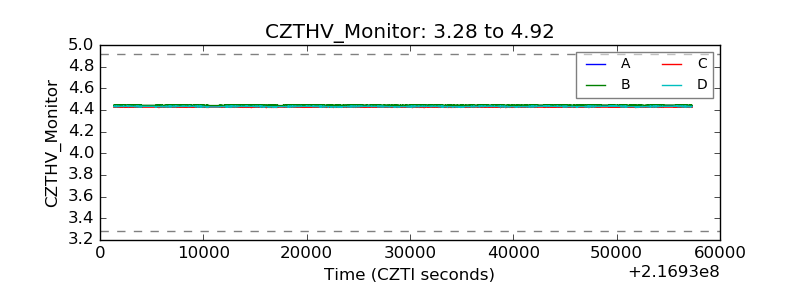 |
| D_VDD |  |
| Temperature 1 |  |
| Veto HV Monitor |  |
| Veto LLD |  |
| Alpha Counter |  |
| _CPM_Rate |  |
| CZT Counter |  |
| +2.5 Volts monitor | 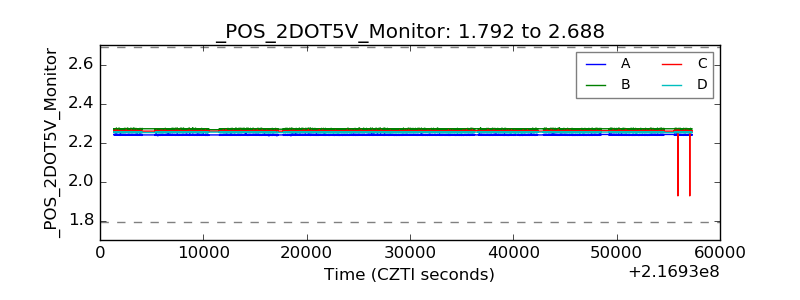 |
| +5 Volts monitor | 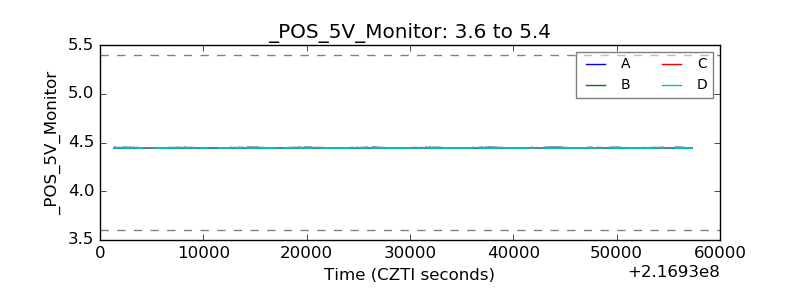 |
| _ROLL_ROT | 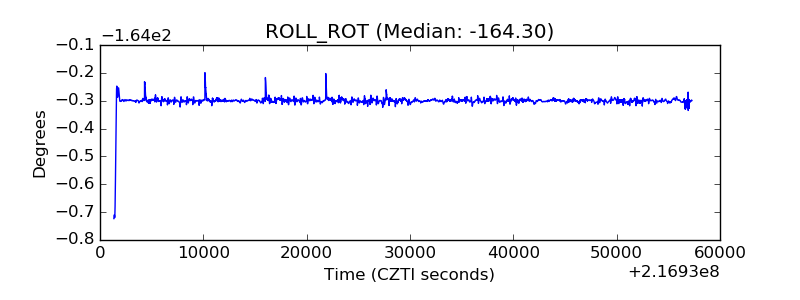 |
| _Roll_DEC |  |
| _Roll_RA |  |
| Veto Counter | 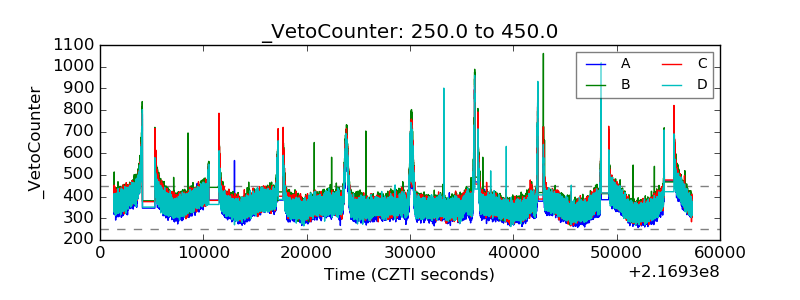 |