| Param | Original file | Final file |
|---|---|---|
| Filename | modeM0/AS1G06_019T01_9000000796cztM0_level2.evt | modeM0/AS1G06_019T01_9000000796cztM0_level2_quad_clean.evt |
| Size (bytes) | 4,632,912,000 | 810,596,160 |
| Size | 4.3 GB | 773.0 MB |
| Events in quadrant A | 39,005,926 | 5,046,277 |
| Events in quadrant B | 36,748,213 | 5,095,452 |
| Events in quadrant C | 29,342,920 | 5,098,050 |
| Events in quadrant D | 30,873,572 | 4,903,767 |
| Mode M0 | |||
|---|---|---|---|
| Quadrant | BADHDUFLAG | Total packets | Discarded packets |
| A | 0 | 159217 | 0 |
| B | 0 | 151633 | 0 |
| C | 0 | 132445 | 0 |
| D | 0 | 138292 | 0 |
| Mode M9 | |||
|---|---|---|---|
| Quadrant | BADHDUFLAG | Total packets | Discarded packets |
| A | 0 | 104 | 0 |
| B | 0 | 104 | 0 |
| C | 0 | 103 | 0 |
| D | 0 | 104 | 0 |
| Mode SS | |||
|---|---|---|---|
| Quadrant | BADHDUFLAG | Total packets | Discarded packets |
| A | 0 | 1322 | 0 |
| B | 0 | 1312 | 0 |
| C | 0 | 1338 | 0 |
| D | 0 | 1318 | 0 |
| Quadrant | Total seconds | Saturated seconds | Saturation percentage |
|---|---|---|---|
| A | 64248 | 2020 | 3.144067% |
| B | 64018 | 2699 | 4.216002% |
| C | 64277 | 550 | 0.855672% |
| D | 64271 | 893 | 1.389429% |
Noise dominated data is calculated using 1-second bins in cleaned event files. If a bin has >2000 counts, and if more than 50% of those come from <1% of pixels, then it is considered to be noise-dominated and hence unusable.
| Quadrant | # 1 sec bins | Bins with >0 counts | Bins with >2000 counts | High rate bins dominated by noise | Noise dominated (total time) | Noise dominated (detector-on time) | Marked lightcurve |
|---|---|---|---|---|---|---|---|
| A | 79498 | 65724 | 1036 | 1036 | 1.30% | 1.58% |  |
| B | 79498 | 65642 | 1171 | 1171 | 1.47% | 1.78% |  |
| C | 79498 | 65830 | 2 | 2 | 0.00% | 0.00% |  |
| D | 79498 | 65751 | 336 | 336 | 0.42% | 0.51% | 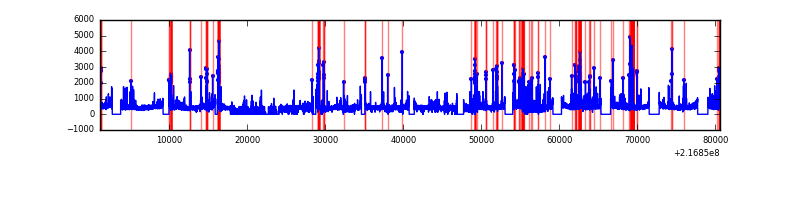 |
Top three noisy pixels from each quadrant. If the there are fewer than three noisy pixels in the level2.evt file, extra rows are filled as -1
| Pixel properties | Quadrant properties | ||||||
|---|---|---|---|---|---|---|---|
| Quadrant | DetID | PixID | Counts | Sigma | Mean | Median | Sigma |
| A | 8 | 15 | 9232709 | 5972.64 | 7574 | 7414 | 1544.6 |
| A | 0 | 254 | 356224 | 225.83 | 7574 | 7414 | 1544.6 |
| A | 13 | 170 | 154867 | 95.46 | 7574 | 7414 | 1544.6 |
| B | 3 | 64 | 6354424 | 4380.21 | 7590 | 7421 | 1449.0 |
| B | 15 | 204 | 299794 | 201.77 | 7590 | 7421 | 1449.0 |
| B | 15 | 85 | 242214 | 162.04 | 7590 | 7421 | 1449.0 |
| C | 1 | 16 | 375332 | 214.61 | 7388 | 7430 | 1714.2 |
| C | 9 | 68 | 69560 | 36.24 | 7388 | 7430 | 1714.2 |
| C | 13 | 61 | 58818 | 29.98 | 7388 | 7430 | 1714.2 |
| D | 13 | 169 | 1813669 | 997.51 | 7382 | 7165 | 1811.0 |
| D | 8 | 195 | 305823 | 164.91 | 7382 | 7165 | 1811.0 |
| D | 5 | 97 | 293504 | 158.11 | 7382 | 7165 | 1811.0 |
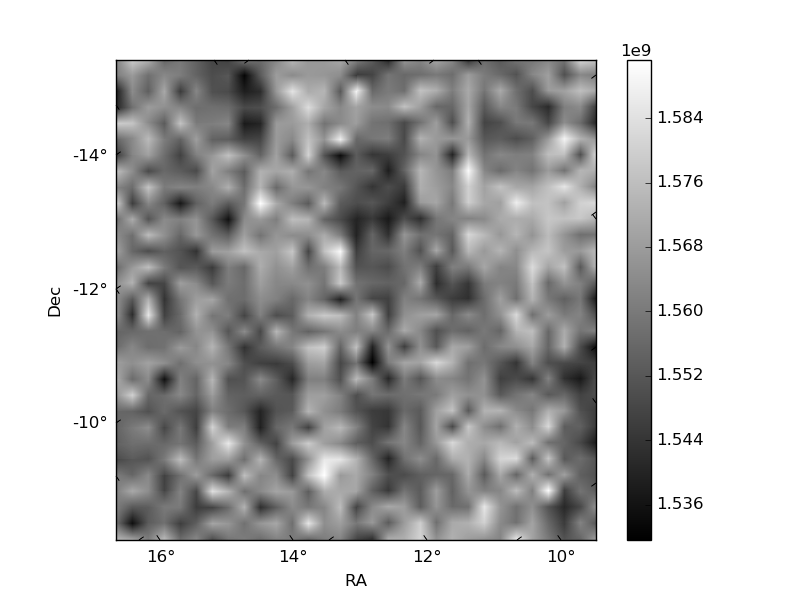
Histogram calculated using DETX and DETY for each event in the final _common_clean file
| Quadrant A |  |
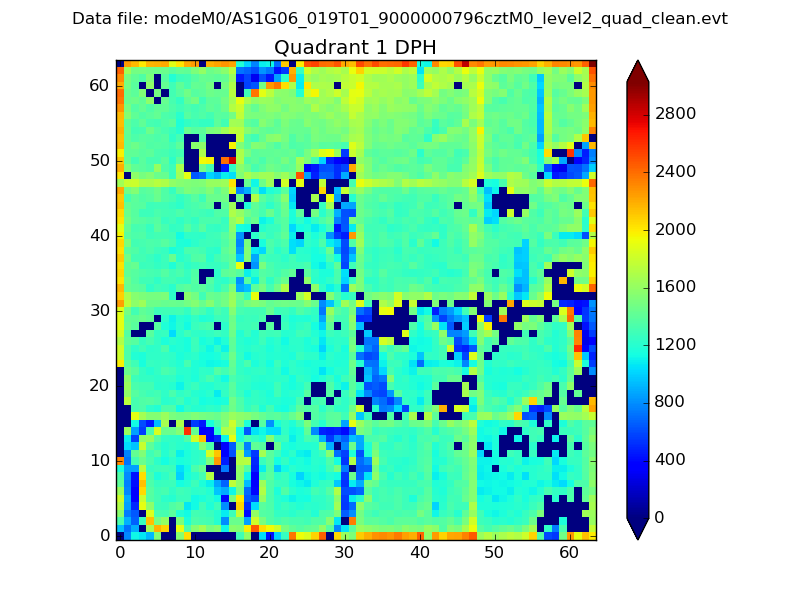 |
Quadrant B |
|---|---|---|---|
| Quadrant D |  |
 |
Quadrant C |
| Plot type | Count rate plots | Images |
|---|---|---|
| Comparison with Poisson distribution Blue bars denote a histogram of data divided into 1 sec bins. Red curve is a Poisson curve with rate = median count rate of data. |
 |
 |
| Quadrant-wise count rates Data is divided into 100 sec bins |
 |
|
| Module-wise count rates for Quadrant A Data is divided into 100 sec bins |
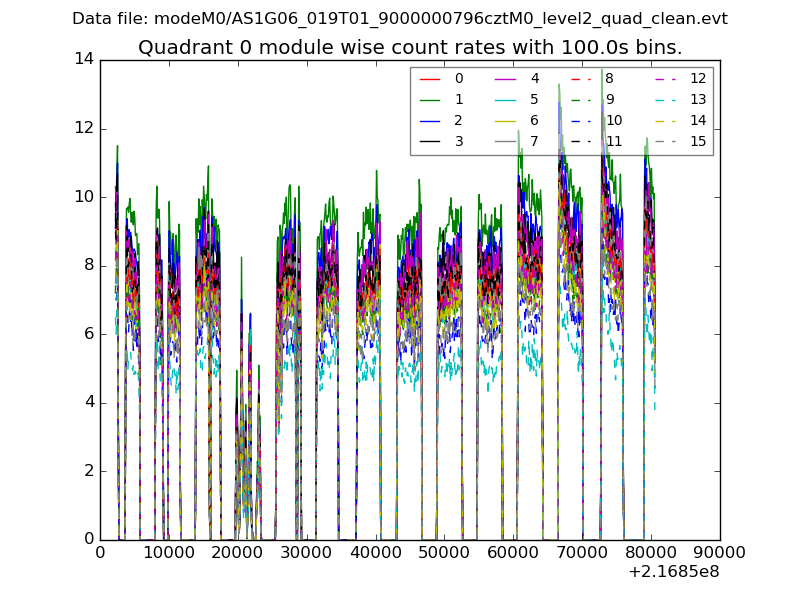 |
 |
| Module-wise count rates for Quadrant B Data is divided into 100 sec bins |
 |
 |
| Module-wise count rates for Quadrant C Data is divided into 100 sec bins |
 |
 |
| Module-wise count rates for Quadrant D Data is divided into 100 sec bins |
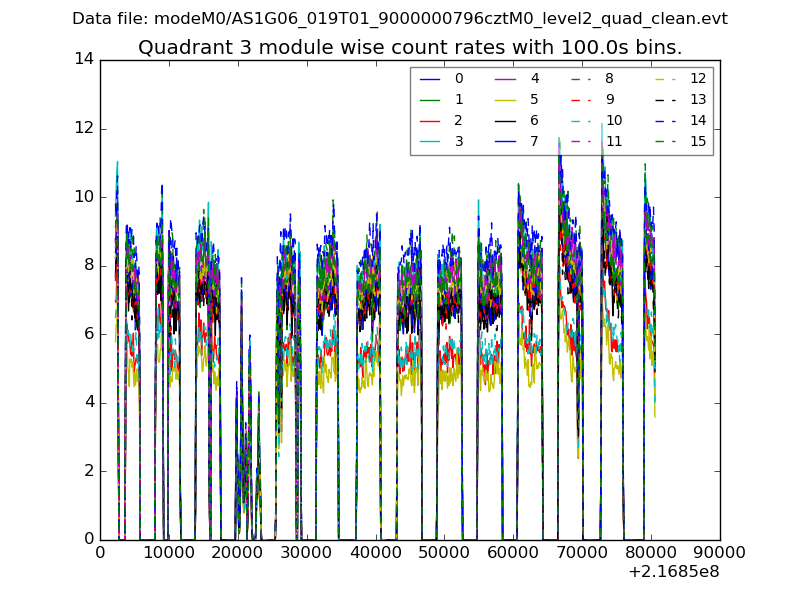 |
 |
| Parameter | Plot |
|---|---|
| CZT HV Monitor |  |
| D_VDD |  |
| Temperature 1 |  |
| Veto HV Monitor |  |
| Veto LLD |  |
| Alpha Counter |  |
| _CPM_Rate |  |
| CZT Counter |  |
| +2.5 Volts monitor | 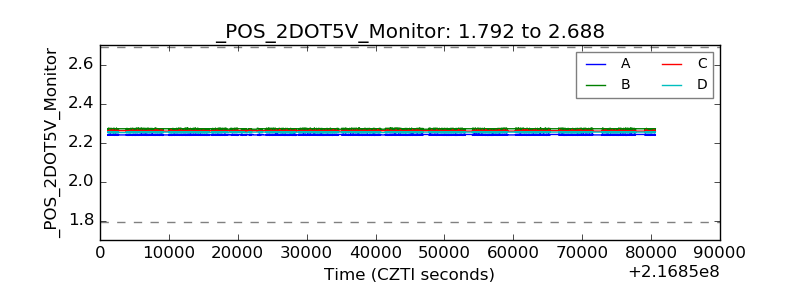 |
| +5 Volts monitor |  |
| _ROLL_ROT |  |
| _Roll_DEC | 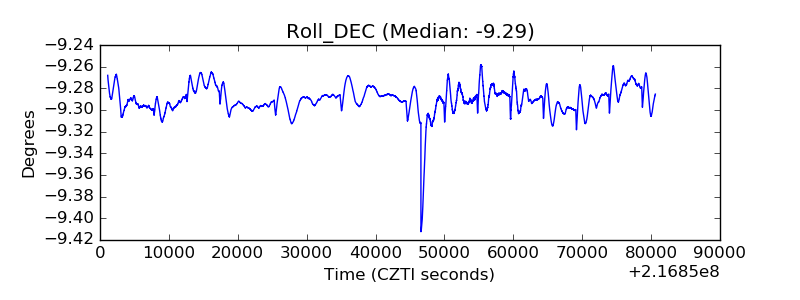 |
| _Roll_RA |  |
| Veto Counter |  |