| Param | Original file | Final file |
|---|---|---|
| Filename | modeM0/AS1A02_104T01_9000000794cztM0_level2.evt | modeM0/AS1A02_104T01_9000000794cztM0_level2_quad_clean.evt |
| Size (bytes) | 4,257,152,640 | 739,497,600 |
| Size | 4.0 GB | 705.2 MB |
| Events in quadrant A | 38,537,771 | 4,536,098 |
| Events in quadrant B | 29,979,849 | 4,733,074 |
| Events in quadrant C | 26,935,837 | 4,690,329 |
| Events in quadrant D | 29,545,156 | 4,442,218 |
| Mode M9 | |||
|---|---|---|---|
| Quadrant | BADHDUFLAG | Total packets | Discarded packets |
| A | 0 | 82 | 0 |
| B | 0 | 81 | 0 |
| C | 0 | 81 | 0 |
| D | 0 | 82 | 0 |
| Mode SS | |||
|---|---|---|---|
| Quadrant | BADHDUFLAG | Total packets | Discarded packets |
| A | 0 | 1186 | 0 |
| B | 0 | 1186 | 0 |
| C | 0 | 1186 | 0 |
| D | 0 | 1186 | 0 |
| Mode M0 | |||
|---|---|---|---|
| Quadrant | BADHDUFLAG | Total packets | Discarded packets |
| A | 0 | 154289 | 0 |
| B | 0 | 127969 | 0 |
| C | 0 | 120848 | 0 |
| D | 0 | 128914 | 0 |
| Quadrant | Total seconds | Saturated seconds | Saturation percentage |
|---|---|---|---|
| A | 58252 | 3172 | 5.445307% |
| B | 58254 | 1115 | 1.914032% |
| C | 58256 | 415 | 0.712373% |
| D | 58253 | 1196 | 2.053113% |
Noise dominated data is calculated using 1-second bins in cleaned event files. If a bin has >2000 counts, and if more than 50% of those come from <1% of pixels, then it is considered to be noise-dominated and hence unusable.
| Quadrant | # 1 sec bins | Bins with >0 counts | Bins with >2000 counts | High rate bins dominated by noise | Noise dominated (total time) | Noise dominated (detector-on time) | Marked lightcurve |
|---|---|---|---|---|---|---|---|
| A | 72963 | 58266 | 1824 | 1824 | 2.50% | 3.13% |  |
| B | 72963 | 58269 | 250 | 250 | 0.34% | 0.43% | 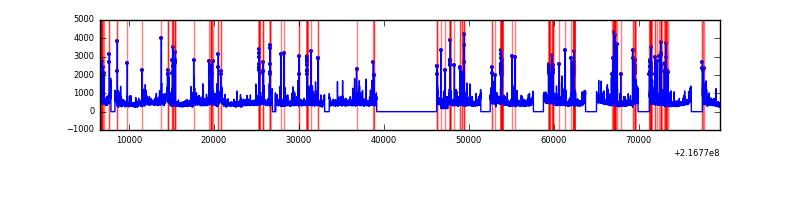 |
| C | 72963 | 58269 | 3 | 3 | 0.00% | 0.01% | 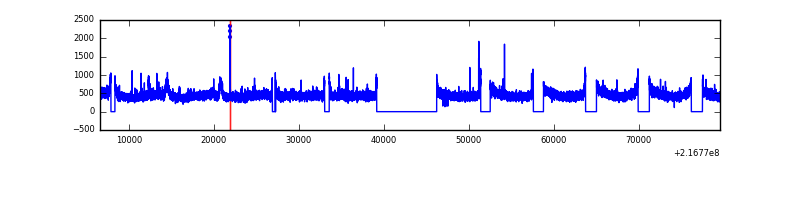 |
| D | 72963 | 58268 | 633 | 633 | 0.87% | 1.09% |  |
Top three noisy pixels from each quadrant. If the there are fewer than three noisy pixels in the level2.evt file, extra rows are filled as -1
| Pixel properties | Quadrant properties | ||||||
|---|---|---|---|---|---|---|---|
| Quadrant | DetID | PixID | Counts | Sigma | Mean | Median | Sigma |
| A | 8 | 15 | 11929370 | 8470.91 | 6852 | 6685 | 1407.5 |
| A | 13 | 251 | 123472 | 82.98 | 6852 | 6685 | 1407.5 |
| A | 12 | 194 | 67859 | 43.46 | 6852 | 6685 | 1407.5 |
| B | 3 | 64 | 1743508 | 1280.55 | 7021 | 6844 | 1356.2 |
| B | 15 | 204 | 287502 | 206.95 | 7021 | 6844 | 1356.2 |
| B | 0 | 214 | 189092 | 134.38 | 7021 | 6844 | 1356.2 |
| C | 1 | 16 | 175398 | 106.5 | 6796 | 6821 | 1582.9 |
| C | 9 | 68 | 135454 | 81.26 | 6796 | 6821 | 1582.9 |
| C | 9 | 54 | 75779 | 43.56 | 6796 | 6821 | 1582.9 |
| D | 15 | 217 | 772733 | 461.75 | 6720 | 6515 | 1659.4 |
| D | 13 | 105 | 630718 | 376.17 | 6720 | 6515 | 1659.4 |
| D | 2 | 33 | 509084 | 302.87 | 6720 | 6515 | 1659.4 |
Histogram calculated using DETX and DETY for each event in the final _common_clean file
| Quadrant A |  |
 |
Quadrant B |
|---|---|---|---|
| Quadrant D |  |
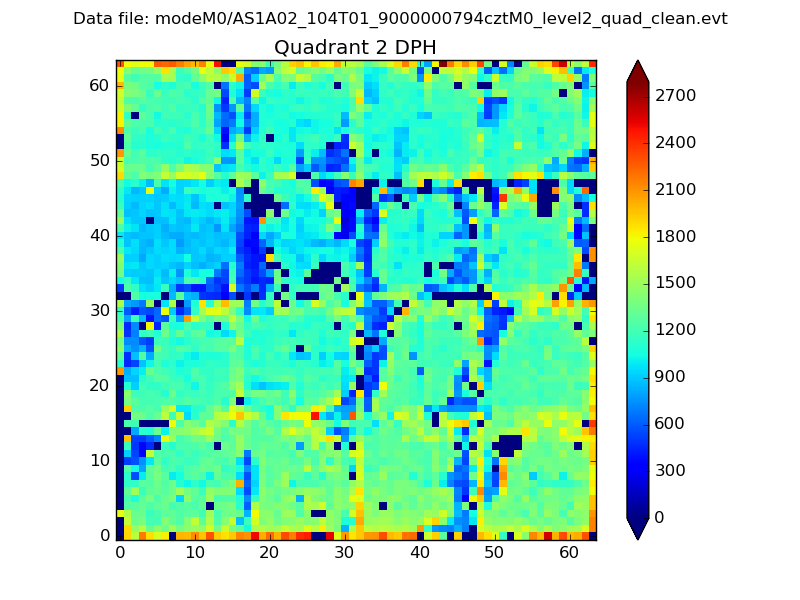 |
Quadrant C |
| Plot type | Count rate plots | Images |
|---|---|---|
| Comparison with Poisson distribution Blue bars denote a histogram of data divided into 1 sec bins. Red curve is a Poisson curve with rate = median count rate of data. |
 |
 |
| Quadrant-wise count rates Data is divided into 100 sec bins |
 |
|
| Module-wise count rates for Quadrant A Data is divided into 100 sec bins |
 |
 |
| Module-wise count rates for Quadrant B Data is divided into 100 sec bins |
 |
 |
| Module-wise count rates for Quadrant C Data is divided into 100 sec bins |
 |
 |
| Module-wise count rates for Quadrant D Data is divided into 100 sec bins |
 |
 |
| Parameter | Plot |
|---|---|
| CZT HV Monitor |  |
| D_VDD |  |
| Temperature 1 |  |
| Veto HV Monitor |  |
| Veto LLD | 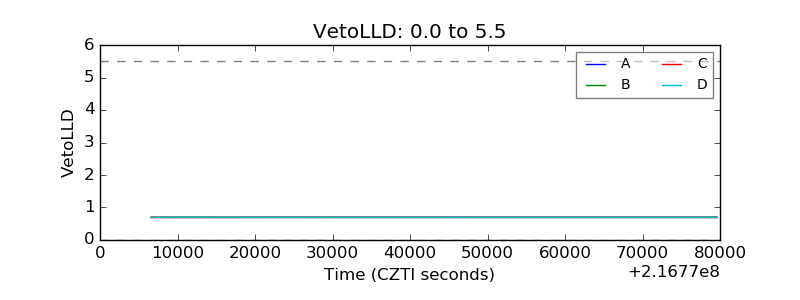 |
| Alpha Counter |  |
| _CPM_Rate |  |
| CZT Counter |  |
| +2.5 Volts monitor |  |
| +5 Volts monitor |  |
| _ROLL_ROT |  |
| _Roll_DEC |  |
| _Roll_RA | 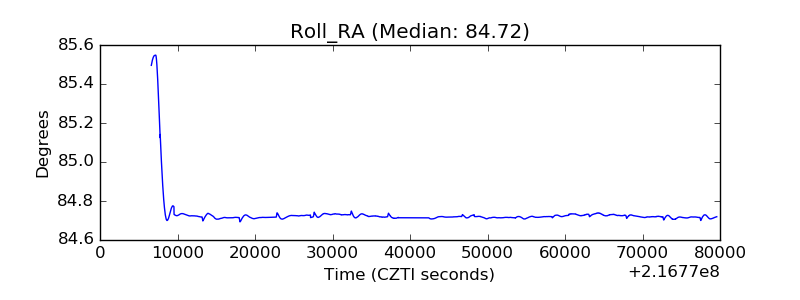 |
| Veto Counter |  |