| Param | Original file | Final file |
|---|---|---|
| Filename | modeM0/AS1G06_168T02_9000000790cztM0_level2.evt | modeM0/AS1G06_168T02_9000000790cztM0_level2_quad_clean.evt |
| Size (bytes) | 582,422,400 | 124,686,720 |
| Size | 555.4 MB | 118.9 MB |
| Events in quadrant A | 4,058,032 | 818,757 |
| Events in quadrant B | 4,544,401 | 817,092 |
| Events in quadrant C | 3,542,687 | 816,863 |
| Events in quadrant D | 4,958,037 | 774,882 |
| Mode M0 | |||
|---|---|---|---|
| Quadrant | BADHDUFLAG | Total packets | Discarded packets |
| A | 0 | 17228 | 0 |
| B | 0 | 18874 | 0 |
| C | 0 | 16206 | 0 |
| D | 0 | 20391 | 0 |
| Mode M9 | |||
|---|---|---|---|
| Quadrant | BADHDUFLAG | Total packets | Discarded packets |
| A | 0 | 19 | 0 |
| B | 0 | 19 | 0 |
| C | 0 | 19 | 0 |
| D | 0 | 19 | 0 |
| Mode SS | |||
|---|---|---|---|
| Quadrant | BADHDUFLAG | Total packets | Discarded packets |
| A | 0 | 158 | 0 |
| B | 0 | 158 | 0 |
| C | 0 | 158 | 0 |
| D | 0 | 158 | 0 |
| Quadrant | Total seconds | Saturated seconds | Saturation percentage |
|---|---|---|---|
| A | 7901 | 70 | 0.885964% |
| B | 7902 | 332 | 4.201468% |
| C | 7902 | 42 | 0.531511% |
| D | 7901 | 309 | 3.910897% |
Noise dominated data is calculated using 1-second bins in cleaned event files. If a bin has >2000 counts, and if more than 50% of those come from <1% of pixels, then it is considered to be noise-dominated and hence unusable.
| Quadrant | # 1 sec bins | Bins with >0 counts | Bins with >2000 counts | High rate bins dominated by noise | Noise dominated (total time) | Noise dominated (detector-on time) | Marked lightcurve |
|---|---|---|---|---|---|---|---|
| A | 8982 | 7902 | 0 | 0 | 0.00% | 0.00% |  |
| B | 8982 | 7902 | 167 | 167 | 1.86% | 2.11% |  |
| C | 8982 | 7903 | 0 | 0 | 0.00% | 0.00% |  |
| D | 8982 | 7902 | 202 | 202 | 2.25% | 2.56% |  |
Top three noisy pixels from each quadrant. If the there are fewer than three noisy pixels in the level2.evt file, extra rows are filled as -1
| Pixel properties | Quadrant properties | ||||||
|---|---|---|---|---|---|---|---|
| Quadrant | DetID | PixID | Counts | Sigma | Mean | Median | Sigma |
| A | 8 | 15 | 413811 | 2141.52 | 943 | 925 | 192.8 |
| A | 0 | 226 | 9153 | 42.68 | 943 | 925 | 192.8 |
| A | 14 | 111 | 9135 | 42.58 | 943 | 925 | 192.8 |
| B | 3 | 64 | 837686 | 4641.75 | 931 | 909 | 180.3 |
| B | 0 | 219 | 45653 | 248.2 | 931 | 909 | 180.3 |
| B | 4 | 81 | 17450 | 91.76 | 931 | 909 | 180.3 |
| C | 1 | 16 | 22158 | 101.12 | 901 | 907 | 210.2 |
| C | 13 | 61 | 7215 | 30.02 | 901 | 907 | 210.2 |
| C | 9 | 16 | 4751 | 18.29 | 901 | 907 | 210.2 |
| D | 11 | 241 | 1257610 | 5636.92 | 904 | 876 | 222.9 |
| D | 13 | 169 | 146697 | 654.06 | 904 | 876 | 222.9 |
| D | 2 | 14 | 30812 | 134.27 | 904 | 876 | 222.9 |
Histogram calculated using DETX and DETY for each event in the final _common_clean file
| Quadrant A |  |
 |
Quadrant B |
|---|---|---|---|
| Quadrant D |  |
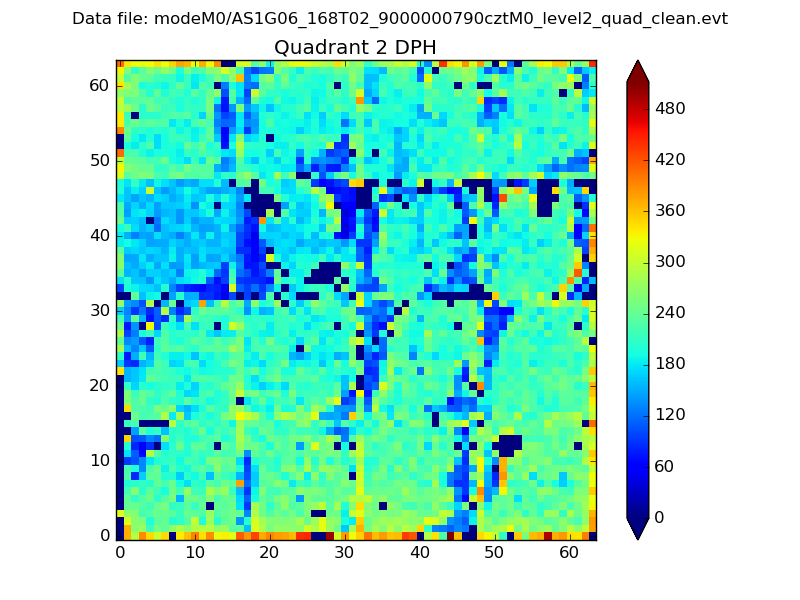 |
Quadrant C |
| Plot type | Count rate plots | Images |
|---|---|---|
| Comparison with Poisson distribution Blue bars denote a histogram of data divided into 1 sec bins. Red curve is a Poisson curve with rate = median count rate of data. |
 |
 |
| Quadrant-wise count rates Data is divided into 100 sec bins |
 |
|
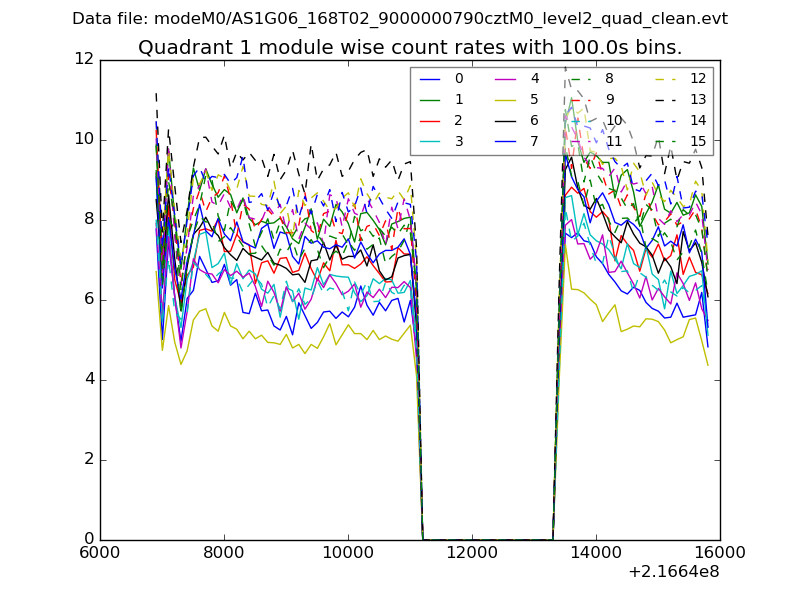
| Module-wise count rates for Quadrant A Data is divided into 100 sec bins |
 |
 |
| Module-wise count rates for Quadrant B Data is divided into 100 sec bins |
 |
 |
| Module-wise count rates for Quadrant C Data is divided into 100 sec bins |
 |
 |
| Module-wise count rates for Quadrant D Data is divided into 100 sec bins |
 |
 |
| Parameter | Plot |
|---|---|
| CZT HV Monitor |  |
| D_VDD |  |
| Temperature 1 |  |
| Veto HV Monitor | 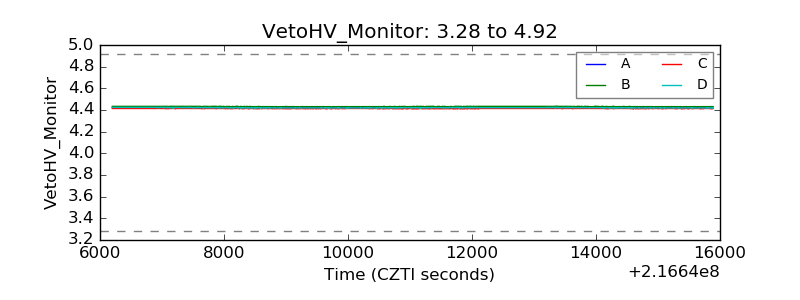 |
| Veto LLD |  |
| Alpha Counter |  |
| _CPM_Rate |  |
| CZT Counter | 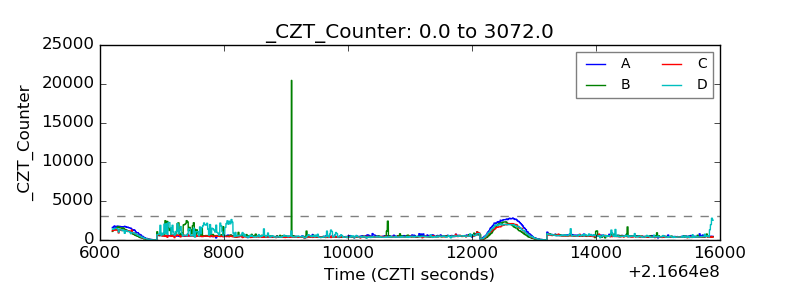 |
| +2.5 Volts monitor | 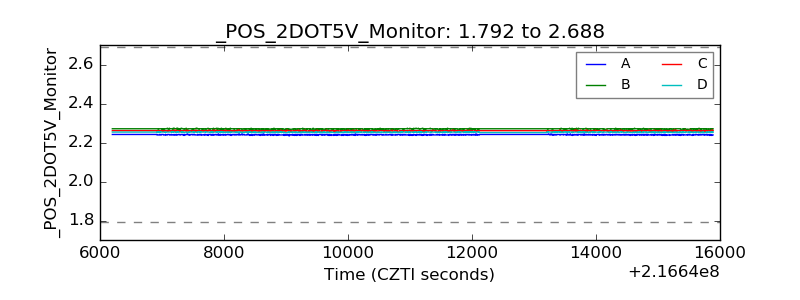 |
| +5 Volts monitor |  |
| _ROLL_ROT | 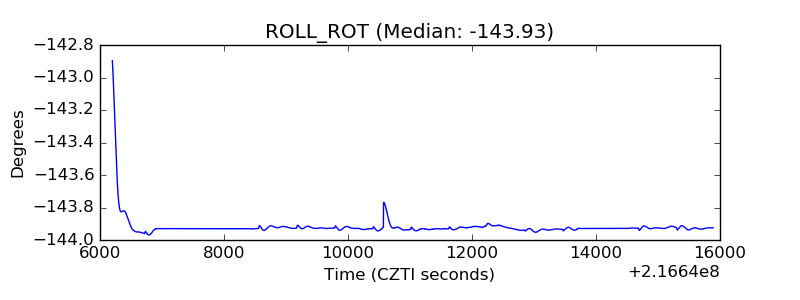 |
| _Roll_DEC |  |
| _Roll_RA |  |
| Veto Counter |  |