| Param | Original file | Final file |
|---|---|---|
| Filename | modeM0/AS1G06_033T01_9000000792cztM0_level2_bc.evt | modeM0/AS1G06_033T01_9000000792cztM0_level2_quad_clean.evt |
| Size (bytes) | 3,646,886,400 | 1,096,182,720 |
| Size | 3.4 GB | 1.0 GB |
| Events in quadrant A | 29,627,190 | 6,679,819 |
| Events in quadrant B | 23,961,020 | 6,841,859 |
| Events in quadrant C | 19,711,528 | 6,768,218 |
| Events in quadrant D | 30,635,900 | 6,357,962 |
| Mode M0 | |||
|---|---|---|---|
| Quadrant | BADHDUFLAG | Total packets | Discarded packets |
| A | 0 | 229031 | 0 |
| B | 0 | 212972 | 0 |
| C | 0 | 199757 | 0 |
| D | 0 | 235161 | 0 |
| Mode SS | |||
|---|---|---|---|
| Quadrant | BADHDUFLAG | Total packets | Discarded packets |
| A | 0 | 1950 | 0 |
| B | 0 | 1952 | 0 |
| C | 0 | 1954 | 0 |
| D | 0 | 1952 | 0 |
| Mode M9 | |||
|---|---|---|---|
| Quadrant | BADHDUFLAG | Total packets | Discarded packets |
| A | 0 | 163 | 0 |
| B | 0 | 163 | 0 |
| C | 0 | 162 | 0 |
| D | 0 | 162 | 0 |
| Quadrant | Total seconds | Saturated seconds | Saturation percentage |
|---|---|---|---|
| A | 95478 | 2392 | 2.505289% |
| B | 95610 | 1897 | 1.984102% |
| C | 95650 | 727 | 0.760063% |
| D | 95597 | 3688 | 3.857862% |
Noise dominated data is calculated using 1-second bins in cleaned event files. If a bin has >2000 counts, and if more than 50% of those come from <1% of pixels, then it is considered to be noise-dominated and hence unusable.
| Quadrant | # 1 sec bins | Bins with >0 counts | Bins with >2000 counts | High rate bins dominated by noise | Noise dominated (total time) | Noise dominated (detector-on time) | Marked lightcurve |
|---|---|---|---|---|---|---|---|
| A | 118432 | 96182 | 414 | 414 | 0.35% | 0.43% |  |
| B | 118432 | 96241 | 100 | 100 | 0.08% | 0.10% |  |
| C | 118432 | 96319 | 1 | 1 | 0.00% | 0.00% |  |
| D | 118432 | 96264 | 1740 | 1740 | 1.47% | 1.81% |  |
Top three noisy pixels from each quadrant. If the there are fewer than three noisy pixels in the level2.evt file, extra rows are filled as -1
| Pixel properties | Quadrant properties | ||||||
|---|---|---|---|---|---|---|---|
| Quadrant | DetID | PixID | Counts | Sigma | Mean | Median | Sigma |
| A | 8 | 15 | 8860340 | 8649.5 | 4648 | 4550 | 1023.9 |
| A | 13 | 170 | 2398848 | 2338.52 | 4648 | 4550 | 1023.9 |
| A | 4 | 2 | 194184 | 185.22 | 4648 | 4550 | 1023.9 |
| B | 3 | 64 | 2313914 | 2576.21 | 4749 | 4616 | 896.4 |
| B | 15 | 204 | 1220024 | 1355.89 | 4749 | 4616 | 896.4 |
| B | 0 | 219 | 523221 | 578.55 | 4749 | 4616 | 896.4 |
| C | 1 | 16 | 1343921 | 1305.54 | 4625 | 4545 | 1025.9 |
| C | 9 | 16 | 119290 | 111.85 | 4625 | 4545 | 1025.9 |
| C | 8 | 128 | 56891 | 51.02 | 4625 | 4545 | 1025.9 |
| D | 11 | 241 | 8460648 | 7674.94 | 4591 | 4385 | 1101.8 |
| D | 13 | 169 | 1729014 | 1565.28 | 4591 | 4385 | 1101.8 |
| D | 2 | 33 | 862045 | 778.42 | 4591 | 4385 | 1101.8 |
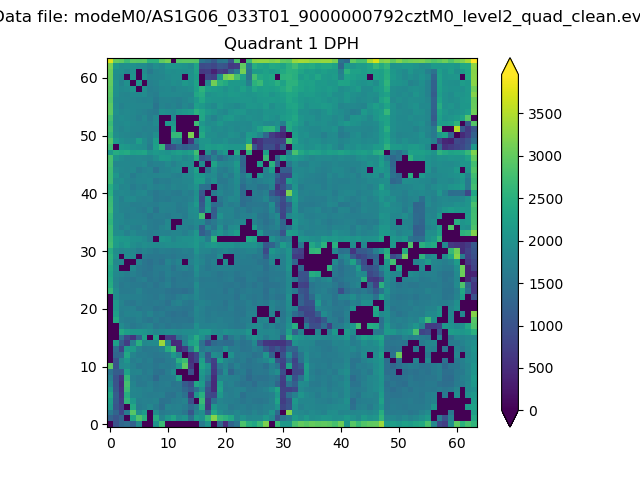
Histogram calculated using DETX and DETY for each event in the final _common_clean file
| Quadrant A |  |
 |
Quadrant B |
|---|---|---|---|
| Quadrant D | 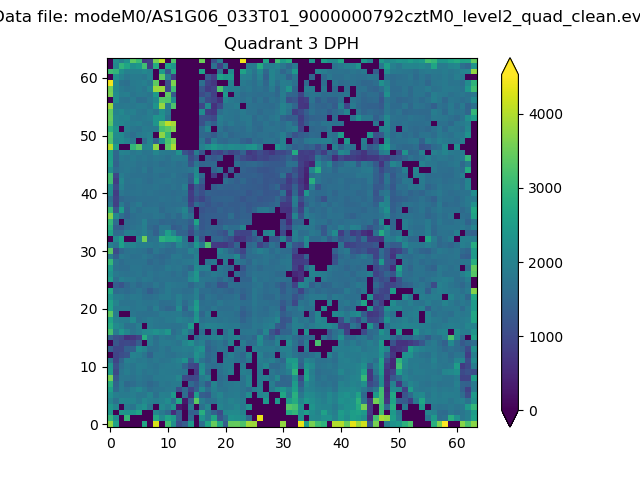 |
 |
Quadrant C |
| Plot type | Count rate plots | Images |
|---|---|---|
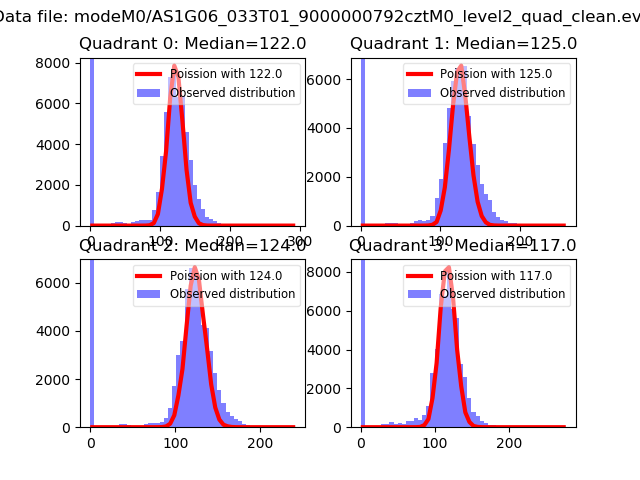
| Comparison with Poisson distribution Blue bars denote a histogram of data divided into 1 sec bins. Red curve is a Poisson curve with rate = median count rate of data. |
 |
 |
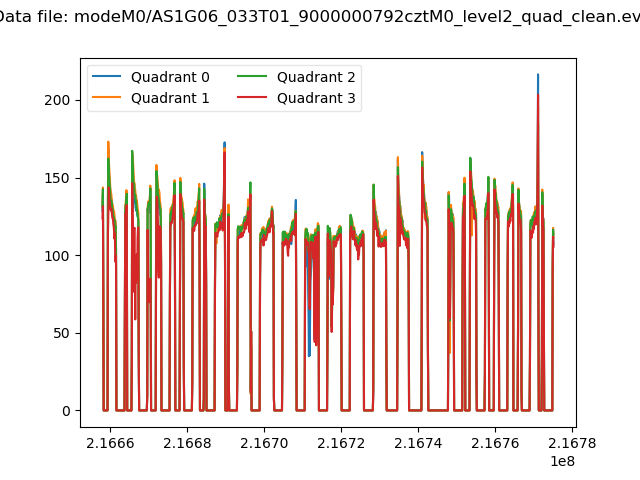
| Quadrant-wise count rates Data is divided into 100 sec bins |
 |
|
| Module-wise count rates for Quadrant A Data is divided into 100 sec bins |
 |
 |
| Module-wise count rates for Quadrant B Data is divided into 100 sec bins |
 |
 |
| Module-wise count rates for Quadrant C Data is divided into 100 sec bins |
 |
 |
| Module-wise count rates for Quadrant D Data is divided into 100 sec bins |
 |
 |
| Parameter | Plot |
|---|---|
| CZT HV Monitor |  |
| D_VDD |  |
| Temperature 1 |  |
| Veto HV Monitor |  |
| Veto LLD |  |
| Alpha Counter |  |
| _CPM_Rate |  |
| CZT Counter | 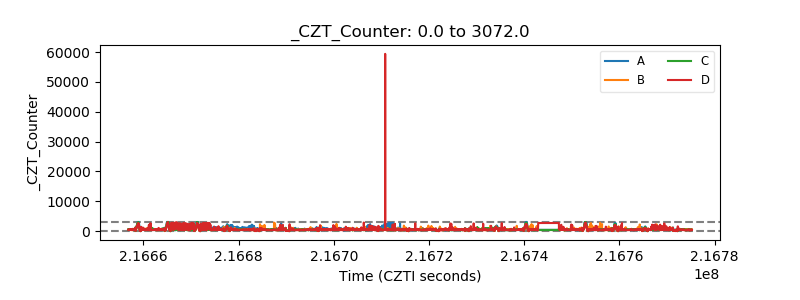 |
| +2.5 Volts monitor |  |
| +5 Volts monitor | 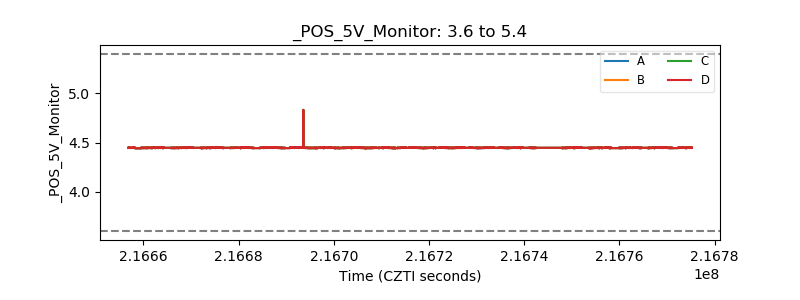 |
| _ROLL_ROT |  |
| _Roll_DEC | 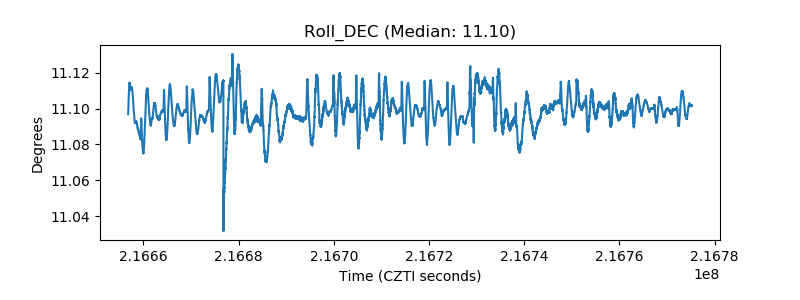 |
| _Roll_RA |  |
| Veto Counter |  |