| Param | Original file | Final file |
|---|---|---|
| Filename | modeM0/AS1G06_168T01_9000000786cztM0_level2.evt | modeM0/AS1G06_168T01_9000000786cztM0_level2_quad_clean.evt |
| Size (bytes) | 324,676,800 | 67,619,520 |
| Size | 309.6 MB | 64.5 MB |
| Events in quadrant A | 2,399,660 | 425,902 |
| Events in quadrant B | 2,503,721 | 430,806 |
| Events in quadrant C | 2,259,713 | 422,253 |
| Events in quadrant D | 2,318,745 | 408,033 |
| Mode SS | |||
|---|---|---|---|
| Quadrant | BADHDUFLAG | Total packets | Discarded packets |
| A | 0 | 108 | 0 |
| B | 0 | 108 | 0 |
| C | 0 | 108 | 0 |
| D | 0 | 108 | 0 |
| Mode M9 | |||
|---|---|---|---|
| Quadrant | BADHDUFLAG | Total packets | Discarded packets |
| A | 0 | 9 | 0 |
| B | 0 | 9 | 0 |
| C | 0 | 9 | 0 |
| D | 0 | 9 | 0 |
| Mode M0 | |||
|---|---|---|---|
| Quadrant | BADHDUFLAG | Total packets | Discarded packets |
| A | 0 | 10656 | 0 |
| B | 0 | 10896 | 0 |
| C | 0 | 10478 | 0 |
| D | 0 | 10700 | 0 |
| Quadrant | Total seconds | Saturated seconds | Saturation percentage |
|---|---|---|---|
| A | 5142 | 61 | 1.186309% |
| B | 5121 | 83 | 1.620777% |
| C | 5130 | 45 | 0.877193% |
| D | 5138 | 56 | 1.089918% |
Noise dominated data is calculated using 1-second bins in cleaned event files. If a bin has >2000 counts, and if more than 50% of those come from <1% of pixels, then it is considered to be noise-dominated and hence unusable.
| Quadrant | # 1 sec bins | Bins with >0 counts | Bins with >2000 counts | High rate bins dominated by noise | Noise dominated (total time) | Noise dominated (detector-on time) | Marked lightcurve |
|---|---|---|---|---|---|---|---|
| A | 6198 | 5204 | 0 | 0 | 0.00% | 0.00% | 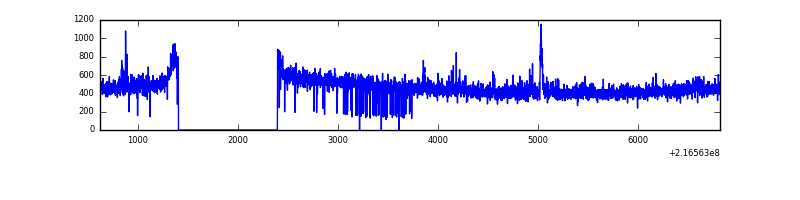 |
| B | 6198 | 5200 | 4 | 4 | 0.06% | 0.08% |  |
| C | 6198 | 5203 | 0 | 0 | 0.00% | 0.00% |  |
| D | 6198 | 5198 | 1 | 1 | 0.02% | 0.02% |  |
Top three noisy pixels from each quadrant. If the there are fewer than three noisy pixels in the level2.evt file, extra rows are filled as -1
| Pixel properties | Quadrant properties | ||||||
|---|---|---|---|---|---|---|---|
| Quadrant | DetID | PixID | Counts | Sigma | Mean | Median | Sigma |
| A | 8 | 15 | 39696 | 316.61 | 596 | 583 | 123.5 |
| A | 15 | 174 | 19525 | 153.33 | 596 | 583 | 123.5 |
| A | 14 | 111 | 19305 | 151.55 | 596 | 583 | 123.5 |
| B | 0 | 214 | 68111 | 580.31 | 600 | 586 | 116.4 |
| B | 0 | 219 | 39721 | 336.32 | 600 | 586 | 116.4 |
| B | 10 | 245 | 20925 | 174.79 | 600 | 586 | 116.4 |
| C | 13 | 61 | 4508 | 28.99 | 578 | 583 | 135.4 |
| C | 14 | 206 | 2718 | 15.77 | 578 | 583 | 135.4 |
| C | 8 | 222 | 2110 | 11.28 | 578 | 583 | 135.4 |
| D | 12 | 221 | 43709 | 301.54 | 578 | 560 | 143.1 |
| D | 13 | 169 | 32162 | 220.85 | 578 | 560 | 143.1 |
| D | 8 | 195 | 22405 | 152.66 | 578 | 560 | 143.1 |
Histogram calculated using DETX and DETY for each event in the final _common_clean file
| Quadrant A |  |
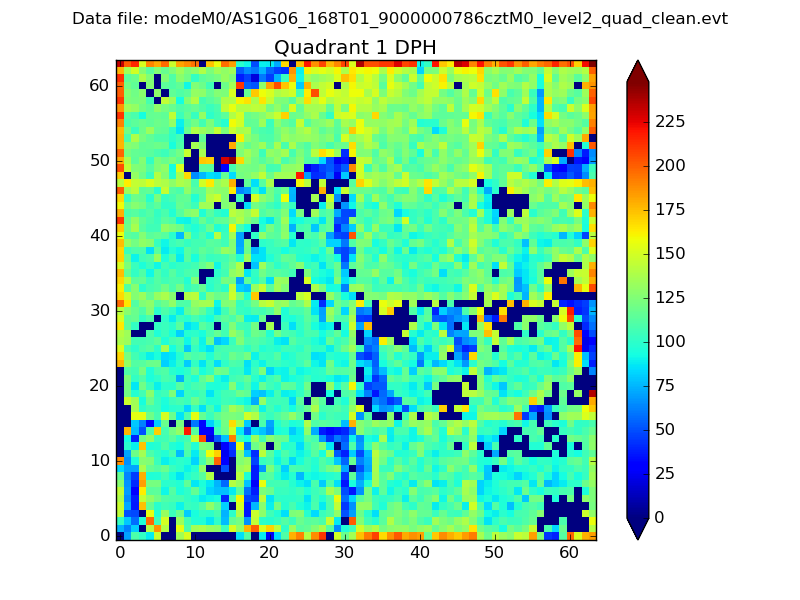 |
Quadrant B |
|---|---|---|---|
| Quadrant D |  |
 |
Quadrant C |
| Plot type | Count rate plots | Images |
|---|---|---|
| Comparison with Poisson distribution Blue bars denote a histogram of data divided into 1 sec bins. Red curve is a Poisson curve with rate = median count rate of data. |
 |
 |
| Quadrant-wise count rates Data is divided into 100 sec bins |
 |
|
| Module-wise count rates for Quadrant A Data is divided into 100 sec bins |
 |
 |
| Module-wise count rates for Quadrant B Data is divided into 100 sec bins |
 |
 |
| Module-wise count rates for Quadrant C Data is divided into 100 sec bins |
 |
 |
| Module-wise count rates for Quadrant D Data is divided into 100 sec bins |
 |
 |
| Parameter | Plot |
|---|---|
| CZT HV Monitor |  |
| D_VDD |  |
| Temperature 1 |  |
| Veto HV Monitor |  |
| Veto LLD | 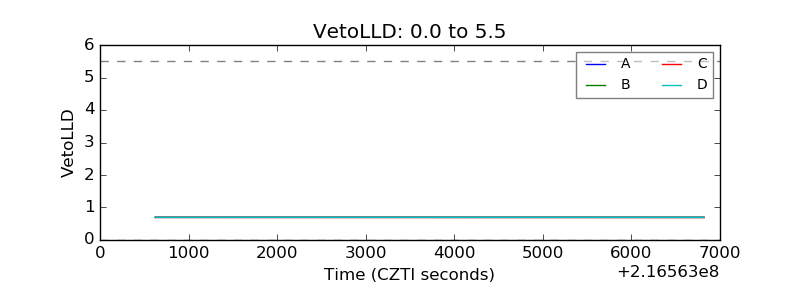 |
| Alpha Counter |  |
| _CPM_Rate |  |
| CZT Counter | 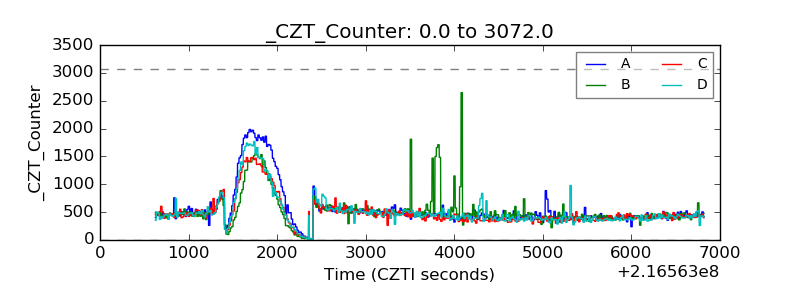 |
| +2.5 Volts monitor |  |
| +5 Volts monitor |  |
| _ROLL_ROT | 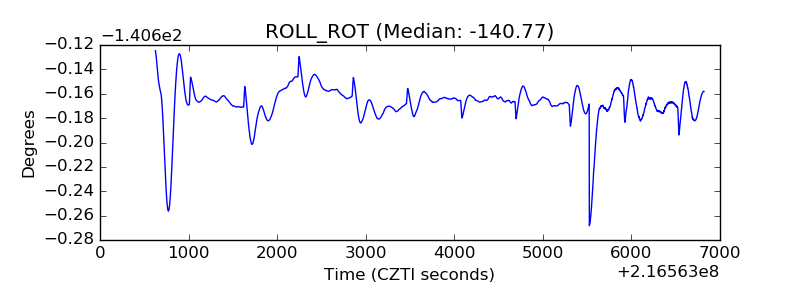 |
| _Roll_DEC |  |
| _Roll_RA |  |
| Veto Counter | 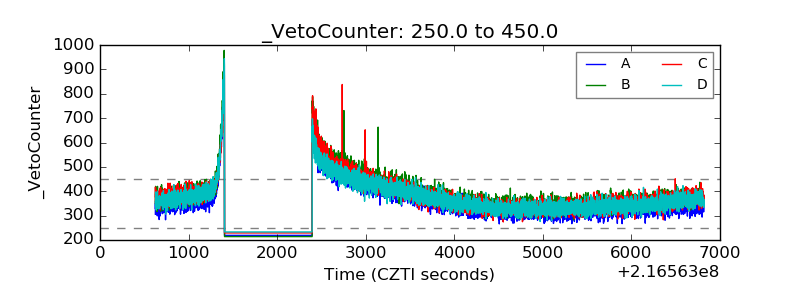 |