| Param | Original file | Final file |
|---|---|---|
| Filename | modeM0/AS1G06_132T01_9000000784cztM0_level2.evt | modeM0/AS1G06_132T01_9000000784cztM0_level2_quad_clean.evt |
| Size (bytes) | 871,640,640 | 184,230,720 |
| Size | 831.3 MB | 175.7 MB |
| Events in quadrant A | 6,639,359 | 1,169,529 |
| Events in quadrant B | 6,706,230 | 1,182,374 |
| Events in quadrant C | 5,702,870 | 1,169,062 |
| Events in quadrant D | 6,433,232 | 1,125,991 |
| Mode M9 | |||
|---|---|---|---|
| Quadrant | BADHDUFLAG | Total packets | Discarded packets |
| A | 1 | 251318637792 | 0 |
| B | 1 | 251318637792 | 0 |
| C | 1 | 251318637792 | 0 |
| D | 1 | 251318637792 | 0 |
| Mode M0 | |||
|---|---|---|---|
| Quadrant | BADHDUFLAG | Total packets | Discarded packets |
| A | 0 | 29189 | 0 |
| B | 0 | 28805 | 0 |
| C | 0 | 27013 | 0 |
| D | 0 | 28911 | 0 |
| Mode SS | |||
|---|---|---|---|
| Quadrant | BADHDUFLAG | Total packets | Discarded packets |
| A | 0 | 340 | 0 |
| B | 0 | 270 | 0 |
| C | 0 | 325 | 0 |
| D | 0 | 332 | 0 |
| Quadrant | Total seconds | Saturated seconds | Saturation percentage |
|---|---|---|---|
| A | 13350 | 248 | 1.857678% |
| B | 13370 | 242 | 1.810022% |
| C | 13329 | 126 | 0.945307% |
| D | 13348 | 293 | 2.195085% |
Noise dominated data is calculated using 1-second bins in cleaned event files. If a bin has >2000 counts, and if more than 50% of those come from <1% of pixels, then it is considered to be noise-dominated and hence unusable.
| Quadrant | # 1 sec bins | Bins with >0 counts | Bins with >2000 counts | High rate bins dominated by noise | Noise dominated (total time) | Noise dominated (detector-on time) | Marked lightcurve |
|---|---|---|---|---|---|---|---|
| A | 22259 | 14216 | 66 | 66 | 0.30% | 0.46% |  |
| B | 22260 | 14176 | 53 | 53 | 0.24% | 0.37% |  |
| C | 22261 | 14116 | 4 | 4 | 0.02% | 0.03% |  |
| D | 22261 | 14114 | 37 | 37 | 0.17% | 0.26% |  |
Top three noisy pixels from each quadrant. If the there are fewer than three noisy pixels in the level2.evt file, extra rows are filled as -1
| Pixel properties | Quadrant properties | ||||||
|---|---|---|---|---|---|---|---|
| Quadrant | DetID | PixID | Counts | Sigma | Mean | Median | Sigma |
| A | 0 | 31 | 712318 | 2334.34 | 1492 | 1456 | 304.5 |
| A | 8 | 15 | 45499 | 144.63 | 1492 | 1456 | 304.5 |
| A | 13 | 34 | 41598 | 131.82 | 1492 | 1456 | 304.5 |
| B | 3 | 64 | 240205 | 820.1 | 1510 | 1471 | 291.1 |
| B | 4 | 81 | 185371 | 631.73 | 1510 | 1471 | 291.1 |
| B | 0 | 214 | 178100 | 606.76 | 1510 | 1471 | 291.1 |
| C | 9 | 54 | 17172 | 46.69 | 1446 | 1448 | 336.8 |
| C | 8 | 128 | 15432 | 41.52 | 1446 | 1448 | 336.8 |
| C | 13 | 61 | 11470 | 29.76 | 1446 | 1448 | 336.8 |
| D | 13 | 169 | 553205 | 1549.7 | 1443 | 1397 | 356.1 |
| D | 8 | 195 | 85096 | 235.06 | 1443 | 1397 | 356.1 |
| D | 13 | 61 | 50836 | 138.84 | 1443 | 1397 | 356.1 |
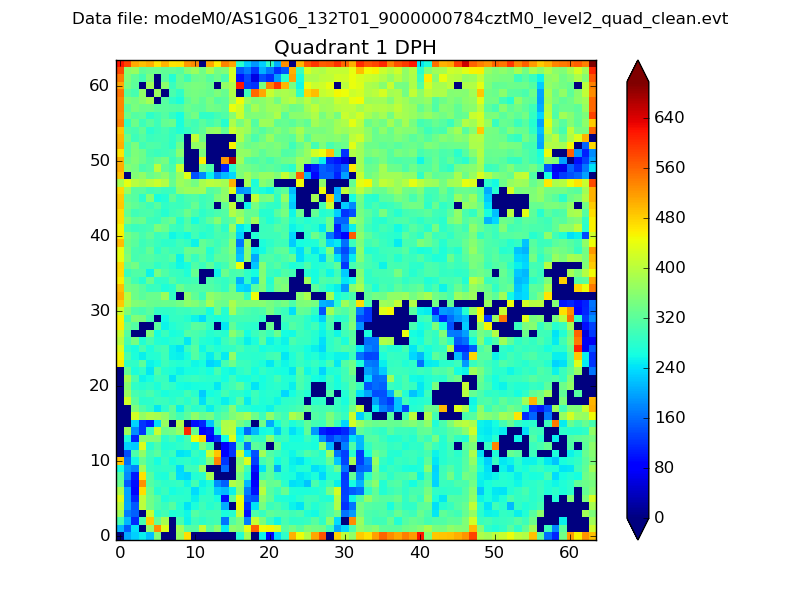
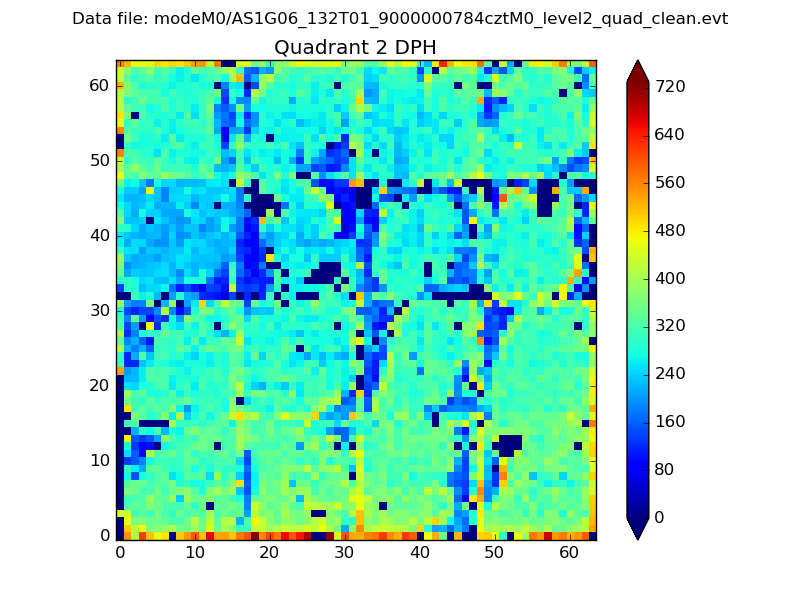
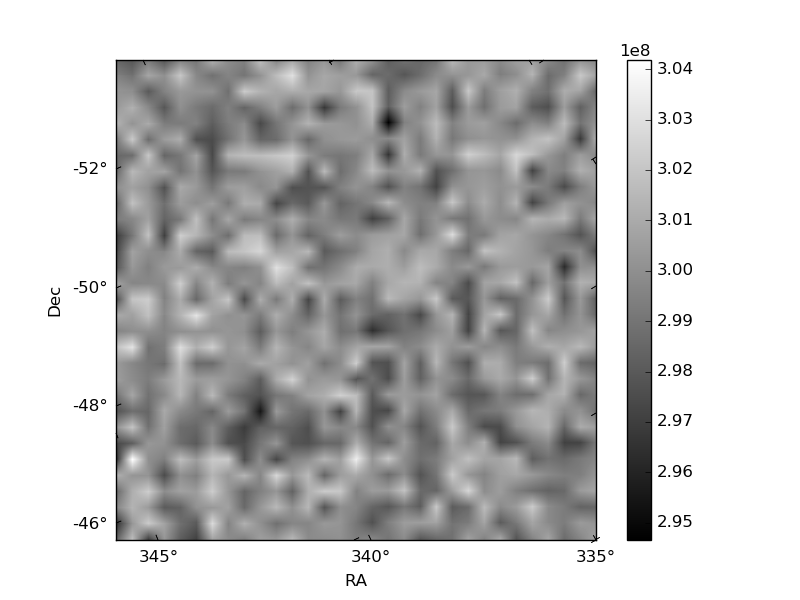
Histogram calculated using DETX and DETY for each event in the final _common_clean file
| Quadrant A |  |
 |
Quadrant B |
|---|---|---|---|
| Quadrant D |  |
 |
Quadrant C |
| Plot type | Count rate plots | Images |
|---|---|---|
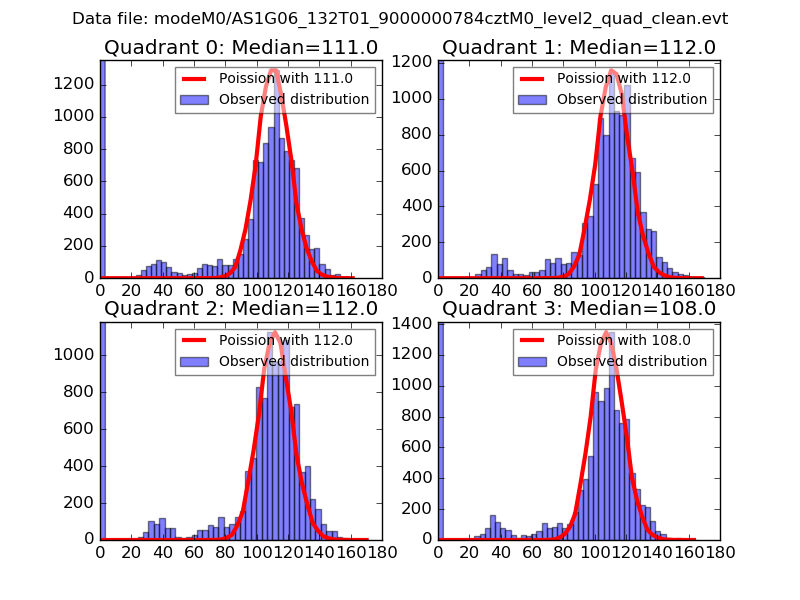
| Comparison with Poisson distribution Blue bars denote a histogram of data divided into 1 sec bins. Red curve is a Poisson curve with rate = median count rate of data. |
 |
 |
| Quadrant-wise count rates Data is divided into 100 sec bins |
 |
|
| Module-wise count rates for Quadrant A Data is divided into 100 sec bins |
 |
 |
| Module-wise count rates for Quadrant B Data is divided into 100 sec bins |
 |
 |
| Module-wise count rates for Quadrant C Data is divided into 100 sec bins |
 |
 |
| Module-wise count rates for Quadrant D Data is divided into 100 sec bins |
 |
 |
| Parameter | Plot |
|---|---|
| CZT HV Monitor | 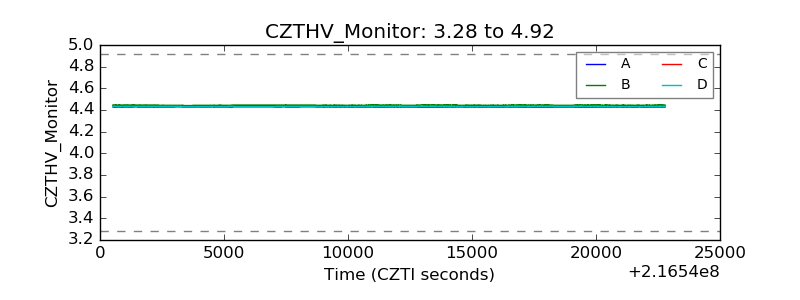 |
| D_VDD |  |
| Temperature 1 |  |
| Veto HV Monitor |  |
| Veto LLD |  |
| Alpha Counter |  |
| _CPM_Rate |  |
| CZT Counter |  |
| +2.5 Volts monitor |  |
| +5 Volts monitor |  |
| _ROLL_ROT |  |
| _Roll_DEC | 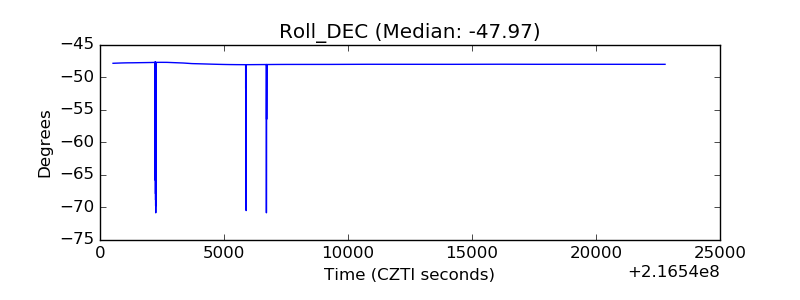 |
| _Roll_RA | 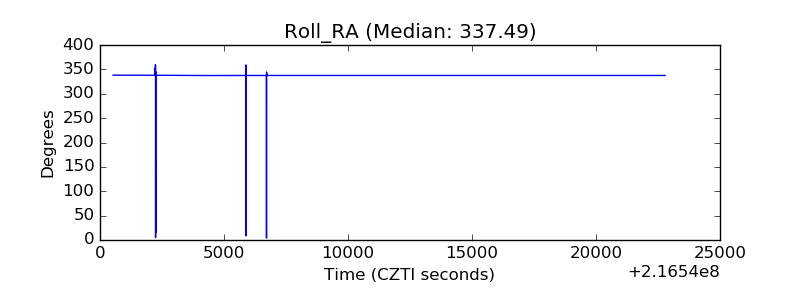 |
| Veto Counter |  |