| Param | Original file | Final file |
|---|---|---|
| Filename | modeM0/AS1A02_028T03_9000000788cztM0_level2.evt | modeM0/AS1A02_028T03_9000000788cztM0_level2_quad_clean.evt |
| Size (bytes) | 4,622,451,840 | 823,645,440 |
| Size | 4.3 GB | 785.5 MB |
| Events in quadrant A | 31,389,475 | 5,232,497 |
| Events in quadrant B | 38,196,928 | 5,131,171 |
| Events in quadrant C | 29,206,708 | 5,224,788 |
| Events in quadrant D | 36,813,987 | 4,902,498 |
| Mode M0 | |||
|---|---|---|---|
| Quadrant | BADHDUFLAG | Total packets | Discarded packets |
| A | 0 | 137817 | 0 |
| B | 0 | 157589 | 0 |
| C | 0 | 133545 | 0 |
| D | 0 | 156554 | 0 |
| Mode M9 | |||
|---|---|---|---|
| Quadrant | BADHDUFLAG | Total packets | Discarded packets |
| A | 0 | 91 | 0 |
| B | 0 | 91 | 0 |
| C | 0 | 91 | 0 |
| D | 0 | 91 | 0 |
| Mode SS | |||
|---|---|---|---|
| Quadrant | BADHDUFLAG | Total packets | Discarded packets |
| A | 0 | 1324 | 0 |
| B | 0 | 1324 | 0 |
| C | 0 | 1320 | 0 |
| D | 0 | 1322 | 0 |
| Quadrant | Total seconds | Saturated seconds | Saturation percentage |
|---|---|---|---|
| A | 64969 | 854 | 1.314473% |
| B | 64941 | 3199 | 4.926010% |
| C | 64979 | 484 | 0.744856% |
| D | 64931 | 2020 | 3.110995% |
Noise dominated data is calculated using 1-second bins in cleaned event files. If a bin has >2000 counts, and if more than 50% of those come from <1% of pixels, then it is considered to be noise-dominated and hence unusable.
| Quadrant | # 1 sec bins | Bins with >0 counts | Bins with >2000 counts | High rate bins dominated by noise | Noise dominated (total time) | Noise dominated (detector-on time) | Marked lightcurve |
|---|---|---|---|---|---|---|---|
| A | 73566 | 65140 | 134 | 134 | 0.18% | 0.21% | 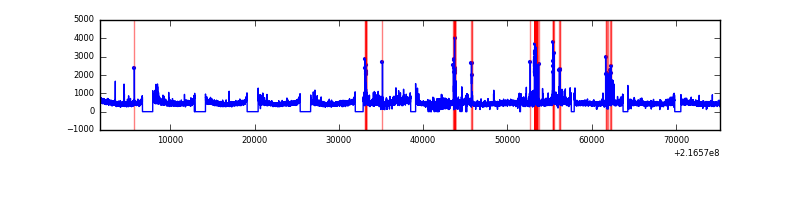 |
| B | 73566 | 65144 | 1661 | 1661 | 2.26% | 2.55% |  |
| C | 73566 | 65149 | 46 | 46 | 0.06% | 0.07% |  |
| D | 73566 | 65132 | 1497 | 1497 | 2.03% | 2.30% |  |
Top three noisy pixels from each quadrant. If the there are fewer than three noisy pixels in the level2.evt file, extra rows are filled as -1
| Pixel properties | Quadrant properties | ||||||
|---|---|---|---|---|---|---|---|
| Quadrant | DetID | PixID | Counts | Sigma | Mean | Median | Sigma |
| A | 8 | 15 | 1710037 | 1116.94 | 7533 | 7355 | 1524.4 |
| A | 0 | 31 | 335326 | 215.15 | 7533 | 7355 | 1524.4 |
| A | 14 | 111 | 170824 | 107.23 | 7533 | 7355 | 1524.4 |
| B | 3 | 64 | 7785787 | 5499.36 | 7480 | 7300 | 1414.4 |
| B | 4 | 81 | 409448 | 284.32 | 7480 | 7300 | 1414.4 |
| B | 0 | 219 | 279167 | 192.21 | 7480 | 7300 | 1414.4 |
| C | 9 | 54 | 274149 | 157.58 | 7374 | 7396 | 1692.8 |
| C | 1 | 16 | 134210 | 74.91 | 7374 | 7396 | 1692.8 |
| C | 13 | 61 | 58827 | 30.38 | 7374 | 7396 | 1692.8 |
| D | 11 | 241 | 6714204 | 3765.25 | 7289 | 7064 | 1781.3 |
| D | 13 | 169 | 1012506 | 564.43 | 7289 | 7064 | 1781.3 |
| D | 8 | 195 | 330149 | 181.37 | 7289 | 7064 | 1781.3 |
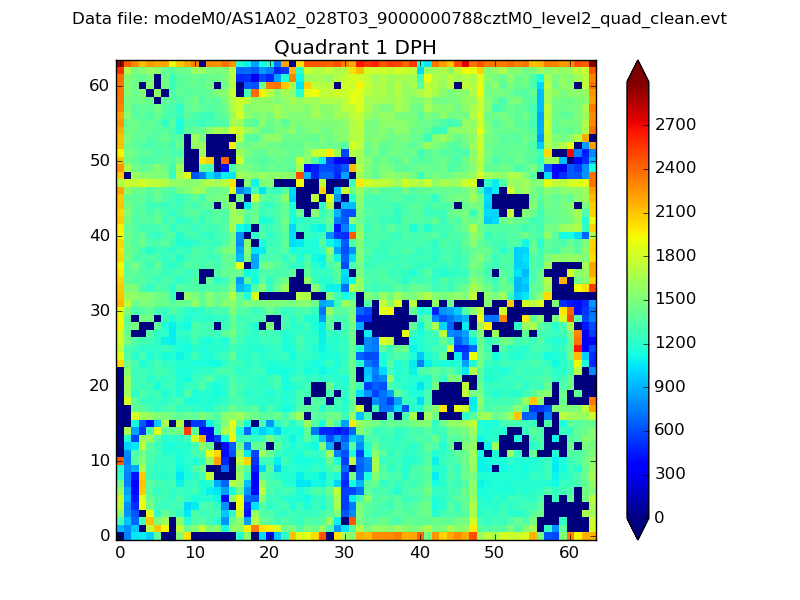
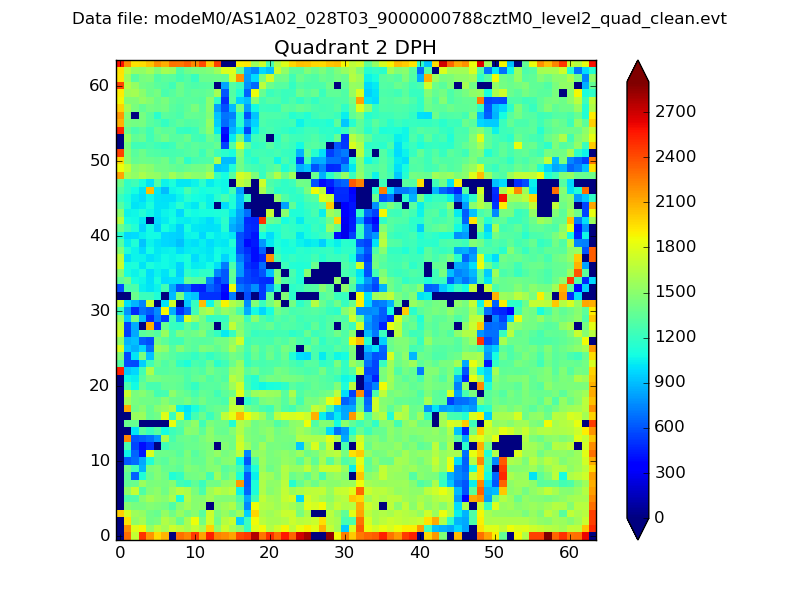
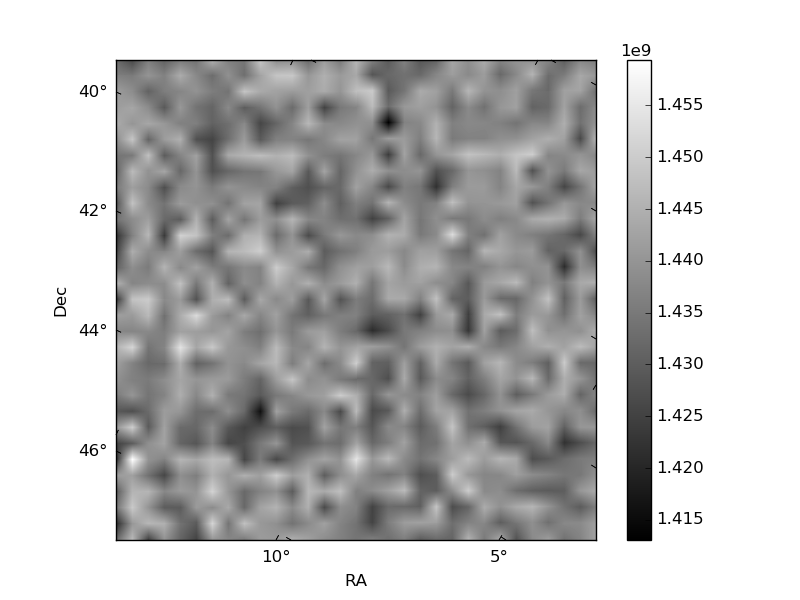
Histogram calculated using DETX and DETY for each event in the final _common_clean file
| Quadrant A |  |
 |
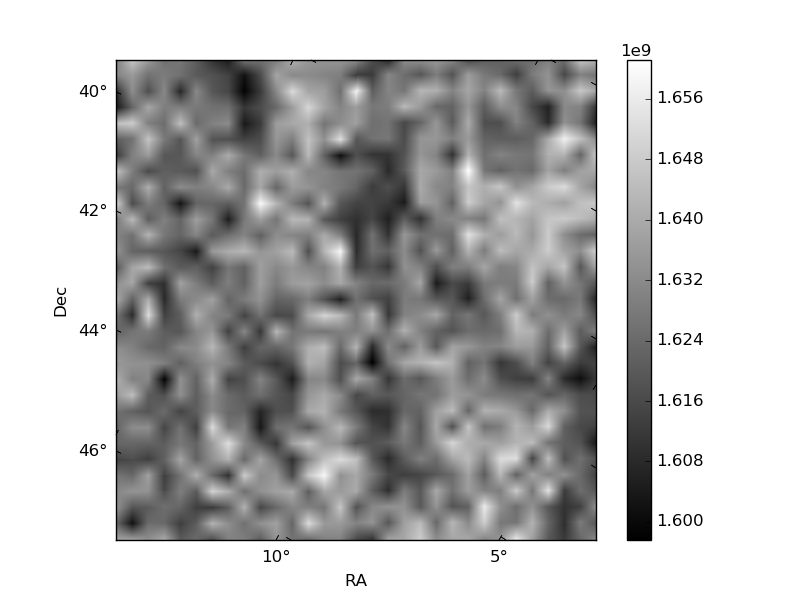
Quadrant B |
|---|---|---|---|
| Quadrant D |  |
 |
Quadrant C |
| Plot type | Count rate plots | Images |
|---|---|---|
| Comparison with Poisson distribution Blue bars denote a histogram of data divided into 1 sec bins. Red curve is a Poisson curve with rate = median count rate of data. |
 |
 |
| Quadrant-wise count rates Data is divided into 100 sec bins |
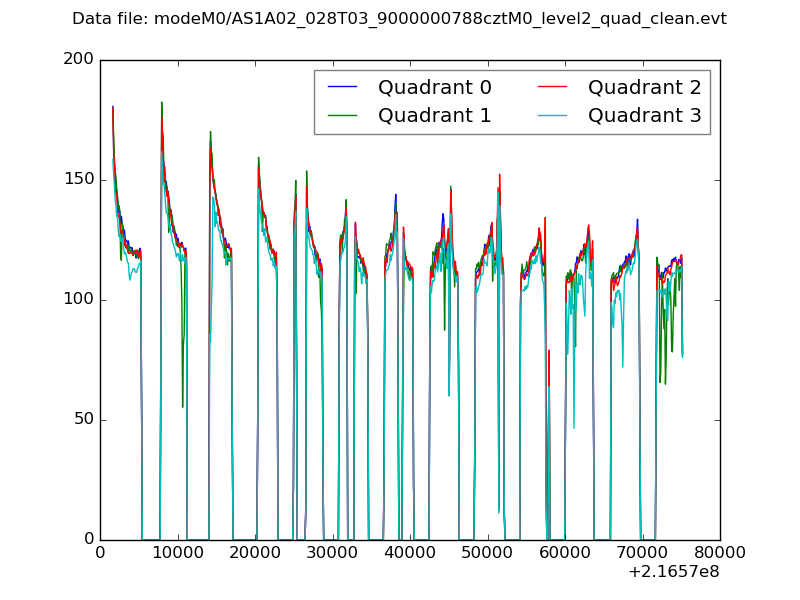 |
|
| Module-wise count rates for Quadrant A Data is divided into 100 sec bins |
 |
 |
| Module-wise count rates for Quadrant B Data is divided into 100 sec bins |
 |
 |
| Module-wise count rates for Quadrant C Data is divided into 100 sec bins |
 |
 |
| Module-wise count rates for Quadrant D Data is divided into 100 sec bins |
 |
 |
| Parameter | Plot |
|---|---|
| CZT HV Monitor |  |
| D_VDD |  |
| Temperature 1 |  |
| Veto HV Monitor |  |
| Veto LLD |  |
| Alpha Counter | 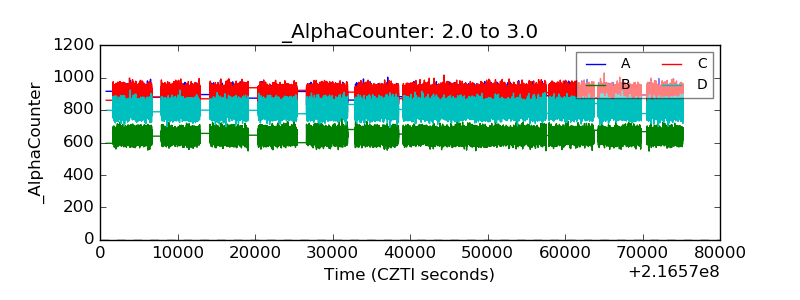 |
| _CPM_Rate |  |
| CZT Counter |  |
| +2.5 Volts monitor |  |
| +5 Volts monitor |  |
| _ROLL_ROT | 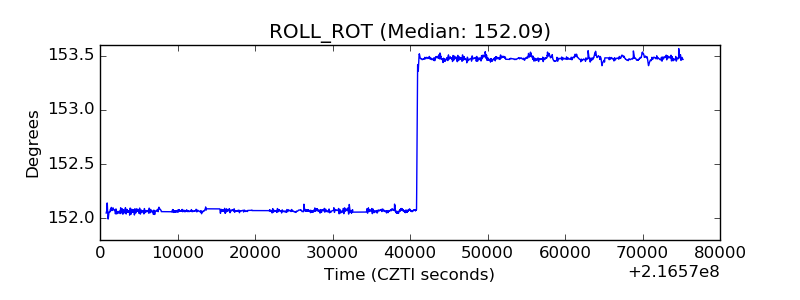 |
| _Roll_DEC |  |
| _Roll_RA |  |
| Veto Counter | 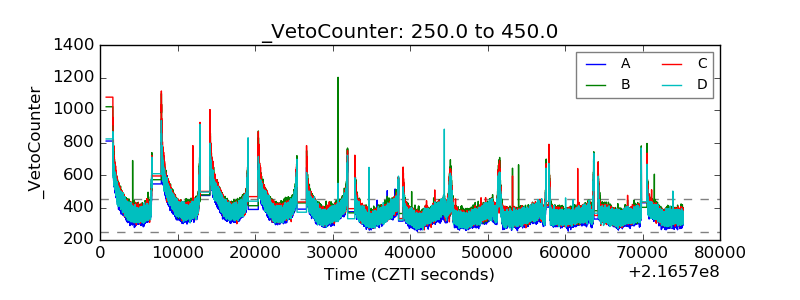 |