| Param | Original file | Final file |
|---|---|---|
| Filename | modeM0/AS1G06_130T01_9000000782cztM0_level2.evt | modeM0/AS1G06_130T01_9000000782cztM0_level2_quad_clean.evt |
| Size (bytes) | 3,240,941,760 | 822,997,440 |
| Size | 3.0 GB | 784.9 MB |
| Events in quadrant A | 22,085,254 | 5,500,916 |
| Events in quadrant B | 25,755,192 | 5,562,312 |
| Events in quadrant C | 22,053,587 | 5,468,726 |
| Events in quadrant D | 25,152,033 | 5,239,345 |
| Mode SS | |||
|---|---|---|---|
| Quadrant | BADHDUFLAG | Total packets | Discarded packets |
| A | 0 | 940 | 0 |
| B | 0 | 940 | 0 |
| C | 0 | 940 | 0 |
| D | 0 | 940 | 0 |
| Mode M9 | |||
|---|---|---|---|
| Quadrant | BADHDUFLAG | Total packets | Discarded packets |
| A | 0 | 71 | 0 |
| B | 0 | 71 | 0 |
| C | 0 | 71 | 0 |
| D | 0 | 71 | 0 |
| Mode M0 | |||
|---|---|---|---|
| Quadrant | BADHDUFLAG | Total packets | Discarded packets |
| A | 0 | 97505 | 0 |
| B | 0 | 107961 | 0 |
| C | 0 | 99480 | 0 |
| D | 0 | 108084 | 0 |
| Quadrant | Total seconds | Saturated seconds | Saturation percentage |
|---|---|---|---|
| A | 46014 | 574 | 1.247446% |
| B | 46012 | 1410 | 3.064418% |
| C | 46013 | 1009 | 2.192859% |
| D | 46013 | 1065 | 2.314563% |
Noise dominated data is calculated using 1-second bins in cleaned event files. If a bin has >2000 counts, and if more than 50% of those come from <1% of pixels, then it is considered to be noise-dominated and hence unusable.
| Quadrant | # 1 sec bins | Bins with >0 counts | Bins with >2000 counts | High rate bins dominated by noise | Noise dominated (total time) | Noise dominated (detector-on time) | Marked lightcurve |
|---|---|---|---|---|---|---|---|
| A | 53049 | 46023 | 13 | 13 | 0.02% | 0.03% |  |
| B | 53048 | 46020 | 472 | 472 | 0.89% | 1.03% |  |
| C | 53049 | 46023 | 540 | 540 | 1.02% | 1.17% |  |
| D | 53049 | 46024 | 646 | 646 | 1.22% | 1.40% | 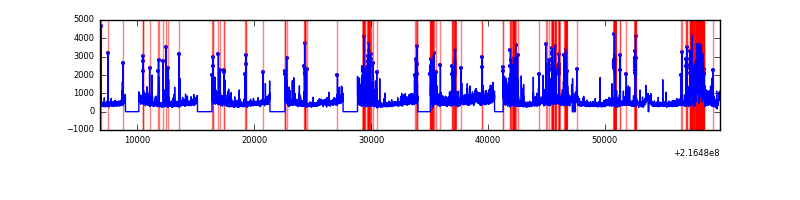 |
Top three noisy pixels from each quadrant. If the there are fewer than three noisy pixels in the level2.evt file, extra rows are filled as -1
| Pixel properties | Quadrant properties | ||||||
|---|---|---|---|---|---|---|---|
| Quadrant | DetID | PixID | Counts | Sigma | Mean | Median | Sigma |
| A | 8 | 15 | 1712266 | 1618.29 | 5238 | 5112 | 1054.9 |
| A | 4 | 2 | 74846 | 66.1 | 5238 | 5112 | 1054.9 |
| A | 14 | 111 | 57101 | 49.28 | 5238 | 5112 | 1054.9 |
| B | 3 | 64 | 3233016 | 3243.57 | 5293 | 5160 | 995.2 |
| B | 4 | 81 | 589867 | 587.55 | 5293 | 5160 | 995.2 |
| B | 15 | 204 | 472601 | 469.72 | 5293 | 5160 | 995.2 |
| C | 9 | 16 | 1758657 | 1510.27 | 5096 | 5107 | 1161.1 |
| C | 9 | 54 | 127566 | 105.47 | 5096 | 5107 | 1161.1 |
| C | 1 | 16 | 118806 | 97.92 | 5096 | 5107 | 1161.1 |
| D | 13 | 169 | 2212459 | 1788.59 | 5080 | 4912 | 1234.2 |
| D | 12 | 221 | 1642303 | 1326.64 | 5080 | 4912 | 1234.2 |
| D | 2 | 33 | 477952 | 383.27 | 5080 | 4912 | 1234.2 |
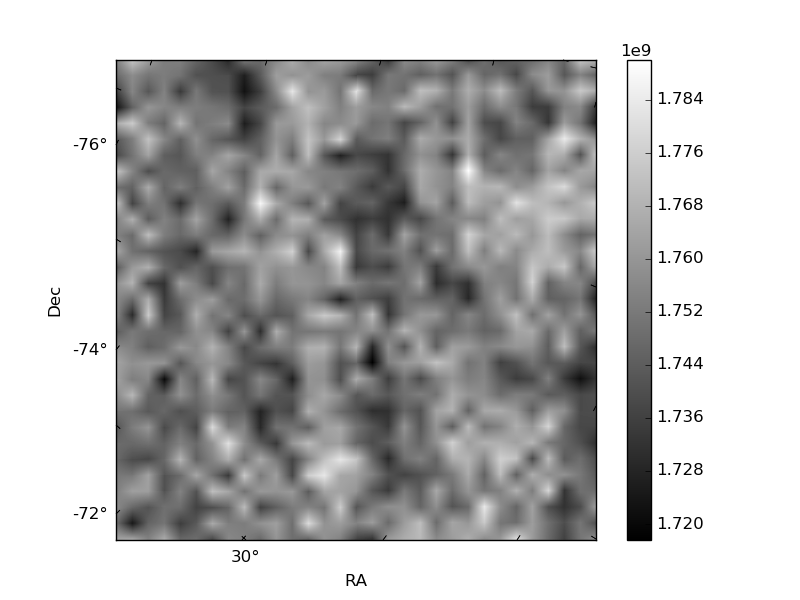
Histogram calculated using DETX and DETY for each event in the final _common_clean file
| Quadrant A |  |
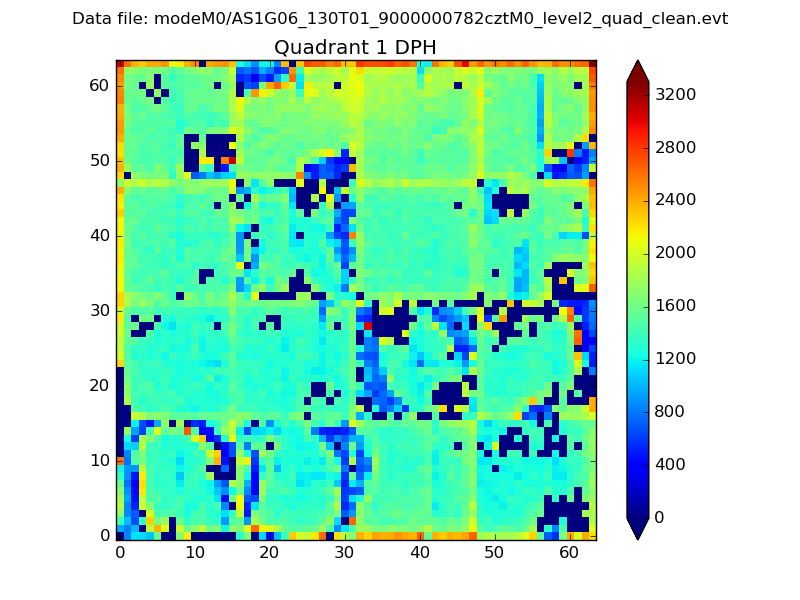 |
Quadrant B |
|---|---|---|---|
| Quadrant D |  |
 |
Quadrant C |
| Plot type | Count rate plots | Images |
|---|---|---|
| Comparison with Poisson distribution Blue bars denote a histogram of data divided into 1 sec bins. Red curve is a Poisson curve with rate = median count rate of data. |
 |
 |
| Quadrant-wise count rates Data is divided into 100 sec bins |
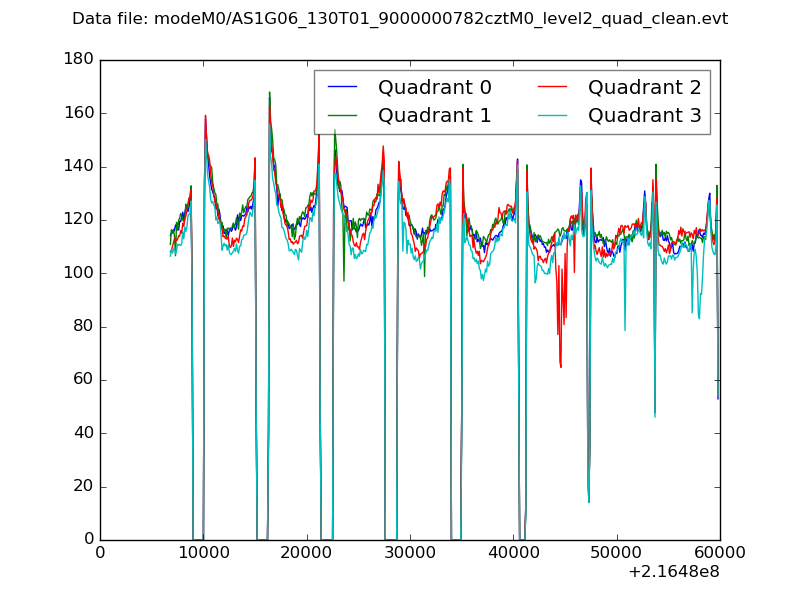 |
|
| Module-wise count rates for Quadrant A Data is divided into 100 sec bins |
 |
 |
| Module-wise count rates for Quadrant B Data is divided into 100 sec bins |
 |
 |
| Module-wise count rates for Quadrant C Data is divided into 100 sec bins |
 |
 |
| Module-wise count rates for Quadrant D Data is divided into 100 sec bins |
 |
 |
| Parameter | Plot |
|---|---|
| CZT HV Monitor |  |
| D_VDD |  |
| Temperature 1 |  |
| Veto HV Monitor |  |
| Veto LLD |  |
| Alpha Counter |  |
| _CPM_Rate |  |
| CZT Counter | 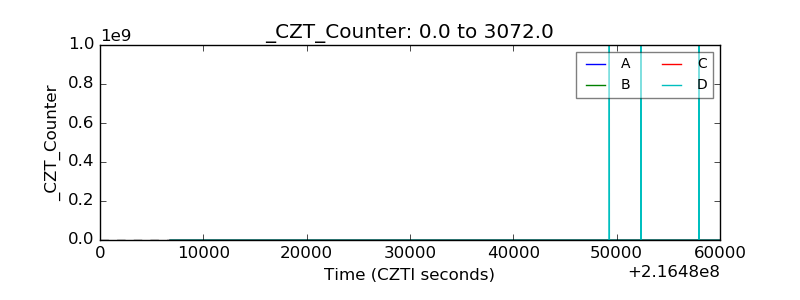 |
| +2.5 Volts monitor |  |
| +5 Volts monitor | 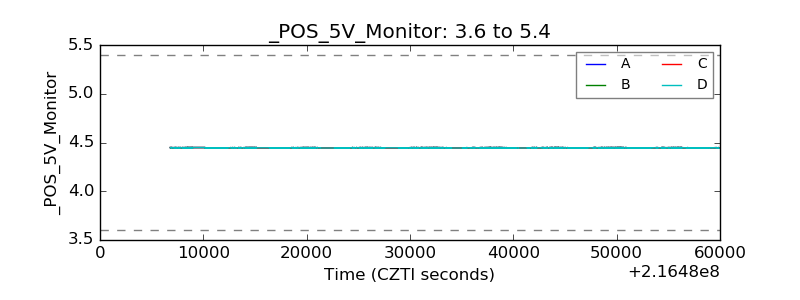 |
| _ROLL_ROT |  |
| _Roll_DEC |  |
| _Roll_RA |  |
| Veto Counter | 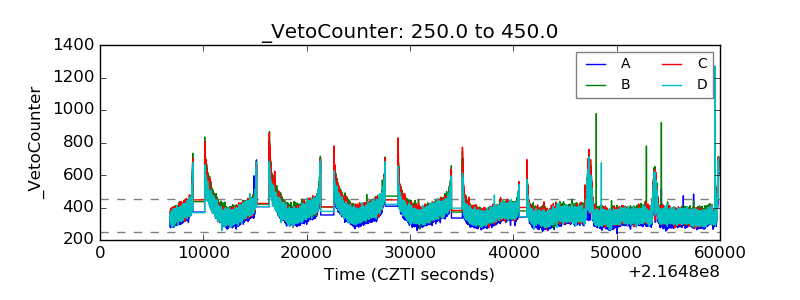 |