| Param | Original file | Final file |
|---|---|---|
| Filename | modeM0/AS1G06_024T01_9000000780cztM0_level2.evt | modeM0/AS1G06_024T01_9000000780cztM0_level2_quad_clean.evt |
| Size (bytes) | 1,900,281,600 | 275,506,560 |
| Size | 1.8 GB | 262.7 MB |
| Events in quadrant A | 13,420,006 | 1,613,827 |
| Events in quadrant B | 15,491,801 | 1,617,163 |
| Events in quadrant C | 12,461,771 | 1,624,706 |
| Events in quadrant D | 14,274,123 | 1,556,016 |
| Mode M9 | |||
|---|---|---|---|
| Quadrant | BADHDUFLAG | Total packets | Discarded packets |
| A | 0 | 21 | 0 |
| B | 0 | 21 | 0 |
| C | 0 | 21 | 0 |
| D | 0 | 21 | 0 |
| Mode M0 | |||
|---|---|---|---|
| Quadrant | BADHDUFLAG | Total packets | Discarded packets |
| A | 0 | 58723 | 0 |
| B | 0 | 64917 | 0 |
| C | 0 | 58010 | 0 |
| D | 0 | 62110 | 0 |
| Mode SS | |||
|---|---|---|---|
| Quadrant | BADHDUFLAG | Total packets | Discarded packets |
| A | 0 | 574 | 0 |
| B | 0 | 584 | 0 |
| C | 0 | 584 | 0 |
| D | 0 | 584 | 0 |
| Quadrant | Total seconds | Saturated seconds | Saturation percentage |
|---|---|---|---|
| A | 28095 | 440 | 1.566115% |
| B | 27848 | 1044 | 3.748923% |
| C | 28208 | 392 | 1.389677% |
| D | 28027 | 554 | 1.976665% |
Noise dominated data is calculated using 1-second bins in cleaned event files. If a bin has >2000 counts, and if more than 50% of those come from <1% of pixels, then it is considered to be noise-dominated and hence unusable.
| Quadrant | # 1 sec bins | Bins with >0 counts | Bins with >2000 counts | High rate bins dominated by noise | Noise dominated (total time) | Noise dominated (detector-on time) | Marked lightcurve |
|---|---|---|---|---|---|---|---|
| A | 47804 | 29905 | 0 | 0 | 0.00% | 0.00% | 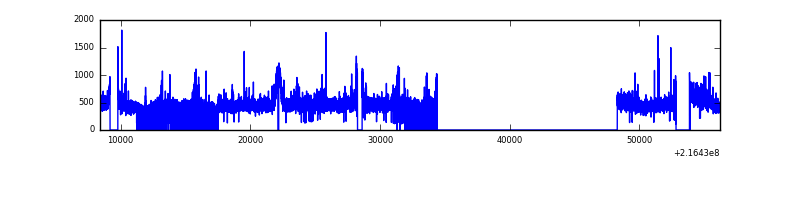 |
| B | 47804 | 29640 | 351 | 351 | 0.73% | 1.18% |  |
| C | 47804 | 29957 | 0 | 0 | 0.00% | 0.00% |  |
| D | 47804 | 29818 | 88 | 88 | 0.18% | 0.30% |  |
Top three noisy pixels from each quadrant. If the there are fewer than three noisy pixels in the level2.evt file, extra rows are filled as -1
| Pixel properties | Quadrant properties | ||||||
|---|---|---|---|---|---|---|---|
| Quadrant | DetID | PixID | Counts | Sigma | Mean | Median | Sigma |
| A | 8 | 15 | 804985 | 1199.66 | 3259 | 3180 | 668.4 |
| A | 13 | 251 | 31220 | 41.95 | 3259 | 3180 | 668.4 |
| A | 0 | 226 | 31110 | 41.79 | 3259 | 3180 | 668.4 |
| B | 3 | 64 | 2446351 | 3924.41 | 3237 | 3160 | 622.6 |
| B | 15 | 204 | 286559 | 455.21 | 3237 | 3160 | 622.6 |
| B | 0 | 219 | 69255 | 106.17 | 3237 | 3160 | 622.6 |
| C | 13 | 61 | 25253 | 29.94 | 3175 | 3194 | 736.7 |
| C | 9 | 16 | 18548 | 20.84 | 3175 | 3194 | 736.7 |
| C | 8 | 128 | 18243 | 20.43 | 3175 | 3194 | 736.7 |
| D | 12 | 221 | 753890 | 956.44 | 3158 | 3055 | 785.0 |
| D | 2 | 63 | 452243 | 572.19 | 3158 | 3055 | 785.0 |
| D | 11 | 241 | 345064 | 435.66 | 3158 | 3055 | 785.0 |
Histogram calculated using DETX and DETY for each event in the final _common_clean file
| Quadrant A |  |
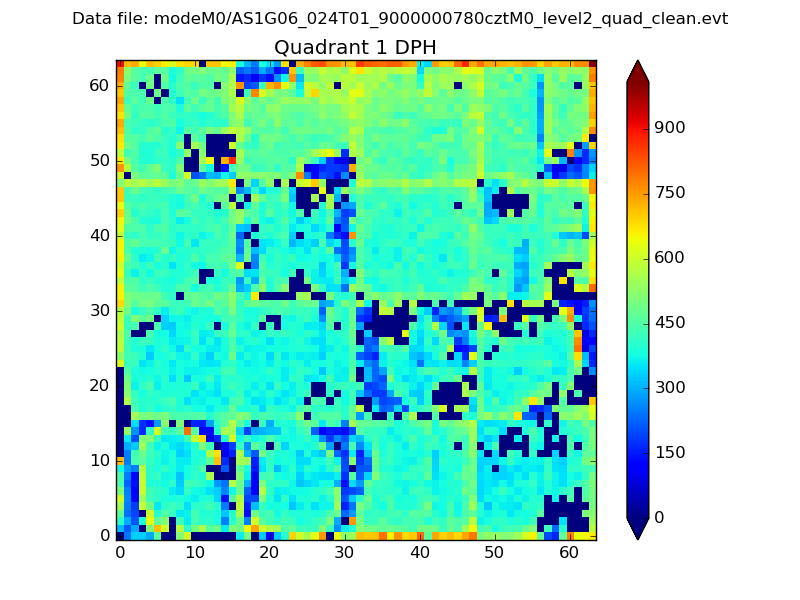 |
Quadrant B |
|---|---|---|---|
| Quadrant D |  |
 |
Quadrant C |
| Plot type | Count rate plots | Images |
|---|---|---|
| Comparison with Poisson distribution Blue bars denote a histogram of data divided into 1 sec bins. Red curve is a Poisson curve with rate = median count rate of data. |
 |
 |
| Quadrant-wise count rates Data is divided into 100 sec bins |
 |
|
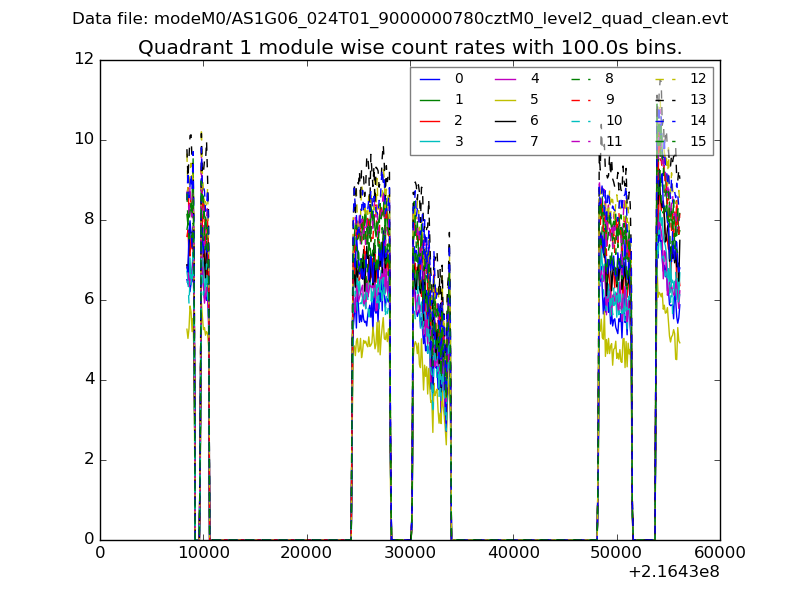
| Module-wise count rates for Quadrant A Data is divided into 100 sec bins |
 |
 |
| Module-wise count rates for Quadrant B Data is divided into 100 sec bins |
 |
 |
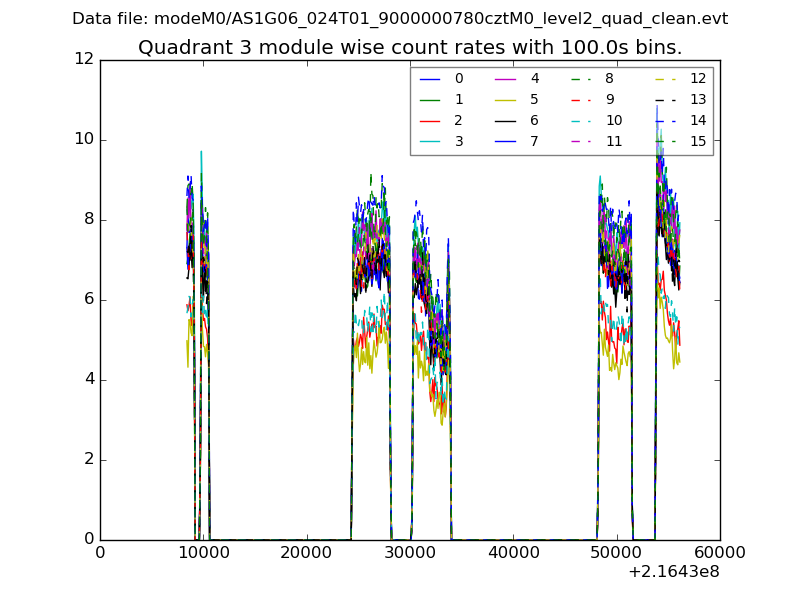
| Module-wise count rates for Quadrant C Data is divided into 100 sec bins |
 |
 |
| Module-wise count rates for Quadrant D Data is divided into 100 sec bins |
 |
 |
| Parameter | Plot |
|---|---|
| CZT HV Monitor |  |
| D_VDD |  |
| Temperature 1 |  |
| Veto HV Monitor |  |
| Veto LLD |  |
| Alpha Counter |  |
| _CPM_Rate |  |
| CZT Counter | 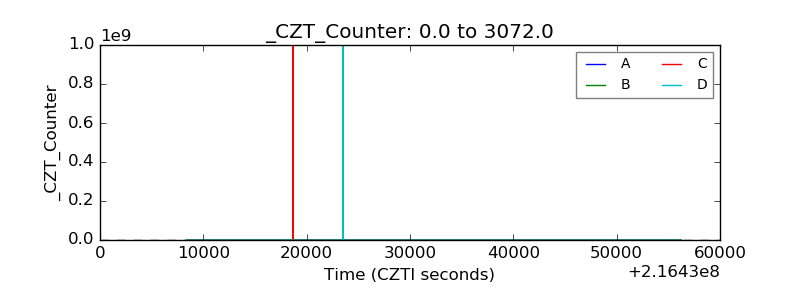 |
| +2.5 Volts monitor |  |
| +5 Volts monitor |  |
| _ROLL_ROT | 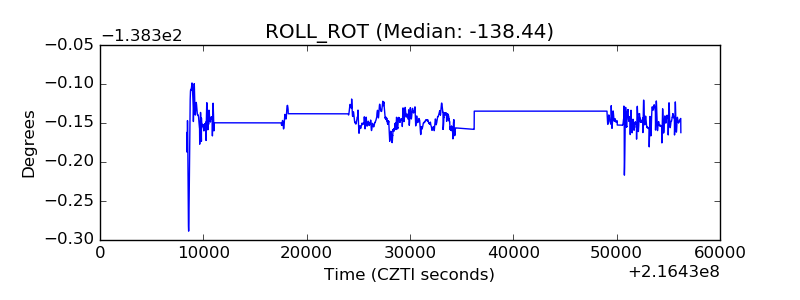 |
| _Roll_DEC |  |
| _Roll_RA |  |
| Veto Counter |  |