| Param | Original file | Final file |
|---|---|---|
| Filename | modeM0/AS1A02_090T01_9000000778cztM0_level2_bc.evt | modeM0/AS1A02_090T01_9000000778cztM0_level2_quad_clean.evt |
| Size (bytes) | 3,651,845,760 | 1,326,260,160 |
| Size | 3.4 GB | 1.2 GB |
| Events in quadrant A | 31,814,439 | 8,410,043 |
| Events in quadrant B | 29,424,689 | 8,568,533 |
| Events in quadrant C | 19,881,190 | 8,543,961 |
| Events in quadrant D | 22,966,871 | 8,099,490 |
| Mode M0 | |||
|---|---|---|---|
| Quadrant | BADHDUFLAG | Total packets | Discarded packets |
| A | 0 | 242035 | 0 |
| B | 0 | 235378 | 0 |
| C | 0 | 197775 | 0 |
| D | 0 | 208904 | 0 |
| Mode SS | |||
|---|---|---|---|
| Quadrant | BADHDUFLAG | Total packets | Discarded packets |
| A | 0 | 1966 | 0 |
| B | 0 | 1956 | 0 |
| C | 0 | 1956 | 0 |
| D | 0 | 1970 | 0 |
| Mode M9 | |||
|---|---|---|---|
| Quadrant | BADHDUFLAG | Total packets | Discarded packets |
| A | 0 | 171 | 0 |
| B | 0 | 170 | 0 |
| C | 0 | 171 | 0 |
| D | 0 | 172 | 0 |
| Quadrant | Total seconds | Saturated seconds | Saturation percentage |
|---|---|---|---|
| A | 95317 | 2601 | 2.728789% |
| B | 95476 | 3943 | 4.129834% |
| C | 95625 | 775 | 0.810458% |
| D | 95613 | 1713 | 1.791597% |
Noise dominated data is calculated using 1-second bins in cleaned event files. If a bin has >2000 counts, and if more than 50% of those come from <1% of pixels, then it is considered to be noise-dominated and hence unusable.
| Quadrant | # 1 sec bins | Bins with >0 counts | Bins with >2000 counts | High rate bins dominated by noise | Noise dominated (total time) | Noise dominated (detector-on time) | Marked lightcurve |
|---|---|---|---|---|---|---|---|
| A | 140493 | 96610 | 43 | 43 | 0.03% | 0.04% |  |
| B | 140493 | 96738 | 275 | 275 | 0.20% | 0.28% |  |
| C | 140493 | 96837 | 19 | 19 | 0.01% | 0.02% |  |
| D | 140493 | 96837 | 139 | 139 | 0.10% | 0.14% | 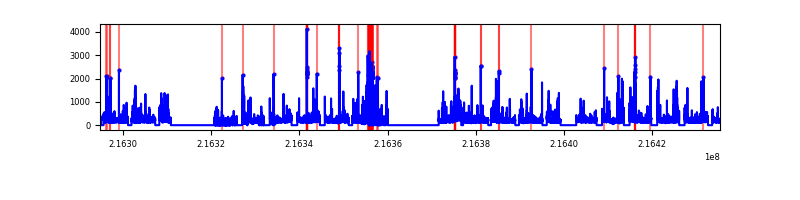 |
Top three noisy pixels from each quadrant. If the there are fewer than three noisy pixels in the level2.evt file, extra rows are filled as -1
| Pixel properties | Quadrant properties | ||||||
|---|---|---|---|---|---|---|---|
| Quadrant | DetID | PixID | Counts | Sigma | Mean | Median | Sigma |
| A | 13 | 34 | 11283538 | 10011.05 | 4949 | 4841 | 1126.6 |
| A | 8 | 15 | 673064 | 593.12 | 4949 | 4841 | 1126.6 |
| A | 15 | 236 | 219185 | 190.25 | 4949 | 4841 | 1126.6 |
| B | 3 | 64 | 6940545 | 7137.12 | 5012 | 4903 | 971.8 |
| B | 15 | 204 | 1347440 | 1381.54 | 5012 | 4903 | 971.8 |
| B | 0 | 214 | 865129 | 885.21 | 5012 | 4903 | 971.8 |
| C | 1 | 16 | 268261 | 240.66 | 4933 | 4904 | 1094.3 |
| C | 9 | 54 | 140180 | 123.62 | 4933 | 4904 | 1094.3 |
| C | 14 | 67 | 49482 | 40.74 | 4933 | 4904 | 1094.3 |
| D | 2 | 16 | 1330320 | 1112.13 | 4905 | 4715 | 1192.0 |
| D | 12 | 79 | 820220 | 684.17 | 4905 | 4715 | 1192.0 |
| D | 8 | 195 | 598195 | 497.9 | 4905 | 4715 | 1192.0 |
Histogram calculated using DETX and DETY for each event in the final _common_clean file
| Quadrant A | 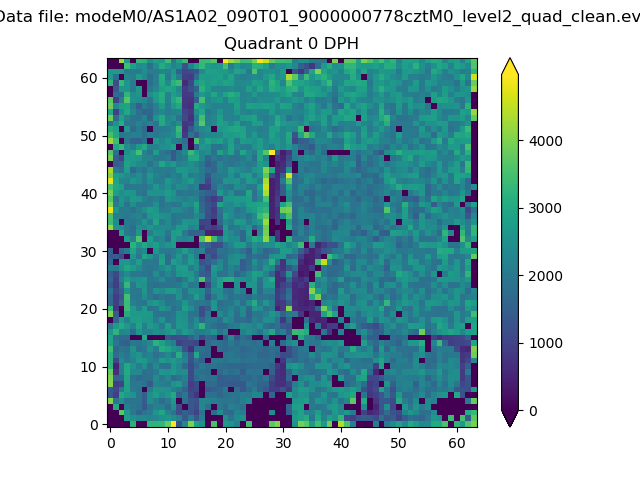 |
 |
Quadrant B |
|---|---|---|---|
| Quadrant D |  |
 |
Quadrant C |
| Plot type | Count rate plots | Images |
|---|---|---|
| Comparison with Poisson distribution Blue bars denote a histogram of data divided into 1 sec bins. Red curve is a Poisson curve with rate = median count rate of data. |
 |
 |
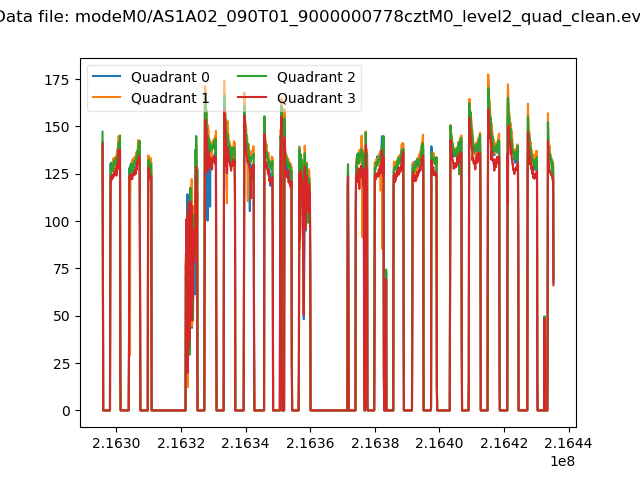
| Quadrant-wise count rates Data is divided into 100 sec bins |
 |
|
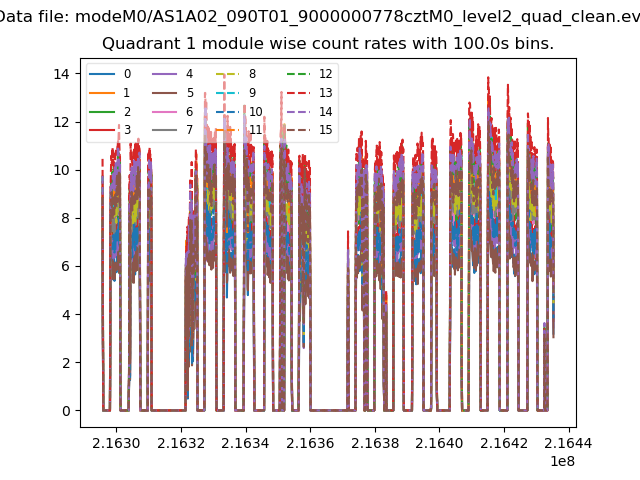
| Module-wise count rates for Quadrant A Data is divided into 100 sec bins |
 |
 |
| Module-wise count rates for Quadrant B Data is divided into 100 sec bins |
 |
 |
| Module-wise count rates for Quadrant C Data is divided into 100 sec bins |
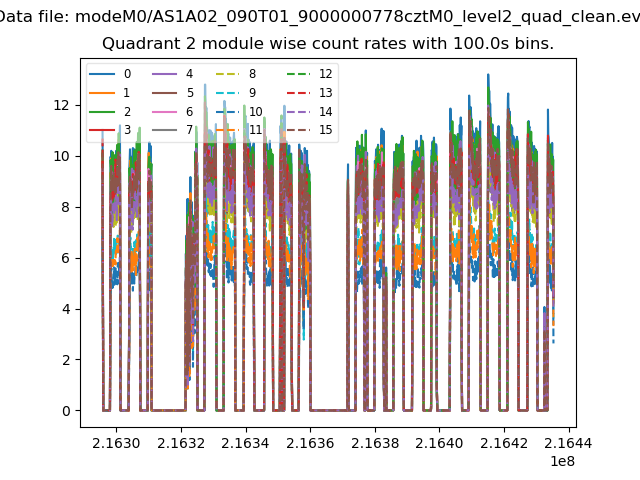 |
 |
| Module-wise count rates for Quadrant D Data is divided into 100 sec bins |
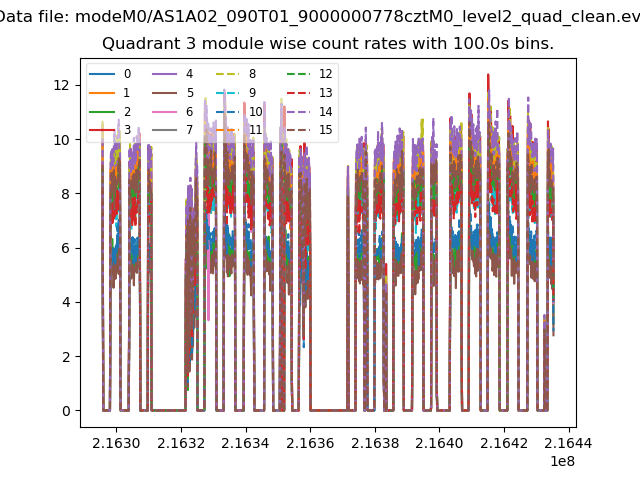 |
 |
| Parameter | Plot |
|---|---|
| CZT HV Monitor |  |
| D_VDD |  |
| Temperature 1 |  |
| Veto HV Monitor |  |
| Veto LLD |  |
| Alpha Counter | 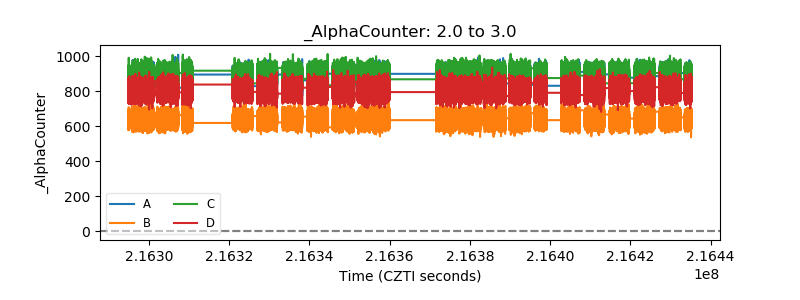 |
| _CPM_Rate |  |
| CZT Counter |  |
| +2.5 Volts monitor |  |
| +5 Volts monitor |  |
| _ROLL_ROT |  |
| _Roll_DEC |  |
| _Roll_RA |  |
| Veto Counter |  |