| Param | Original file | Final file |
|---|---|---|
| Filename | modeM0/AS1A02_006T01_9000000776cztM0_level2_bc.evt | modeM0/AS1A02_006T01_9000000776cztM0_level2_quad_clean.evt |
| Size (bytes) | 2,340,774,720 | 852,998,400 |
| Size | 2.2 GB | 813.5 MB |
| Events in quadrant A | 21,577,213 | 5,298,346 |
| Events in quadrant B | 16,773,194 | 5,446,873 |
| Events in quadrant C | 13,948,729 | 5,282,355 |
| Events in quadrant D | 13,931,500 | 5,123,253 |
| Mode M9 | |||
|---|---|---|---|
| Quadrant | BADHDUFLAG | Total packets | Discarded packets |
| A | 0 | 108 | 0 |
| B | 0 | 106 | 0 |
| C | 0 | 108 | 0 |
| D | 0 | 106 | 0 |
| Mode SS | |||
|---|---|---|---|
| Quadrant | BADHDUFLAG | Total packets | Discarded packets |
| A | 0 | 1392 | 0 |
| B | 0 | 1406 | 0 |
| C | 0 | 1390 | 0 |
| D | 0 | 1389 | 0 |
| Mode M0 | |||
|---|---|---|---|
| Quadrant | BADHDUFLAG | Total packets | Discarded packets |
| A | 0 | 163629 | 0 |
| B | 0 | 150971 | 0 |
| C | 0 | 142970 | 0 |
| D | 0 | 143567 | 0 |
| Quadrant | Total seconds | Saturated seconds | Saturation percentage |
|---|---|---|---|
| A | 68105 | 1293 | 1.898539% |
| B | 68269 | 1562 | 2.288008% |
| C | 68276 | 1102 | 1.614037% |
| D | 68452 | 872 | 1.273885% |
Noise dominated data is calculated using 1-second bins in cleaned event files. If a bin has >2000 counts, and if more than 50% of those come from <1% of pixels, then it is considered to be noise-dominated and hence unusable.
| Quadrant | # 1 sec bins | Bins with >0 counts | Bins with >2000 counts | High rate bins dominated by noise | Noise dominated (total time) | Noise dominated (detector-on time) | Marked lightcurve |
|---|---|---|---|---|---|---|---|
| A | 80759 | 69691 | 19 | 19 | 0.02% | 0.03% |  |
| B | 80759 | 69727 | 81 | 81 | 0.10% | 0.12% |  |
| C | 80759 | 69671 | 140 | 140 | 0.17% | 0.20% | 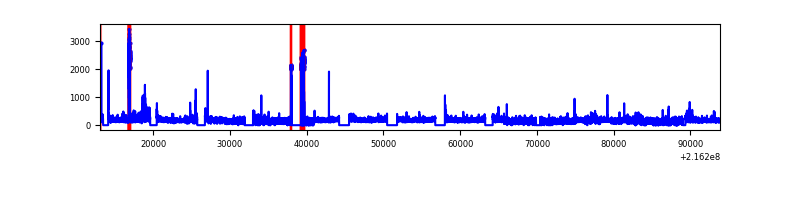 |
| D | 80759 | 69814 | 10 | 10 | 0.01% | 0.01% | 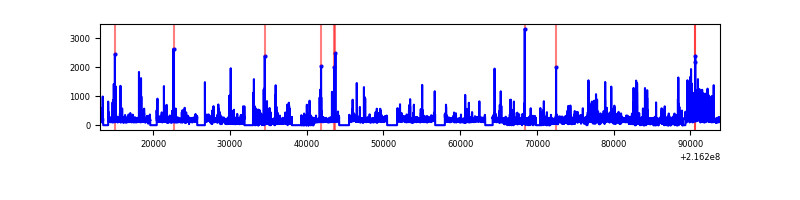 |
Top three noisy pixels from each quadrant. If the there are fewer than three noisy pixels in the level2.evt file, extra rows are filled as -1
| Pixel properties | Quadrant properties | ||||||
|---|---|---|---|---|---|---|---|
| Quadrant | DetID | PixID | Counts | Sigma | Mean | Median | Sigma |
| A | 13 | 34 | 8028987 | 11161.68 | 3252 | 3176 | 719.1 |
| A | 15 | 234 | 407903 | 562.86 | 3252 | 3176 | 719.1 |
| A | 15 | 236 | 241629 | 331.62 | 3252 | 3176 | 719.1 |
| B | 3 | 64 | 1876641 | 2920.33 | 3338 | 3231 | 641.5 |
| B | 15 | 204 | 1345869 | 2092.95 | 3338 | 3231 | 641.5 |
| B | 0 | 219 | 167253 | 255.68 | 3338 | 3231 | 641.5 |
| C | 1 | 241 | 1044683 | 1443.12 | 3239 | 3178 | 721.7 |
| C | 1 | 16 | 62095 | 81.64 | 3239 | 3178 | 721.7 |
| C | 9 | 54 | 40941 | 52.32 | 3239 | 3178 | 721.7 |
| D | 12 | 6 | 525667 | 688.02 | 3251 | 3118 | 759.5 |
| D | 5 | 97 | 163580 | 211.27 | 3251 | 3118 | 759.5 |
| D | 8 | 195 | 162075 | 209.29 | 3251 | 3118 | 759.5 |
Histogram calculated using DETX and DETY for each event in the final _common_clean file
| Quadrant A | 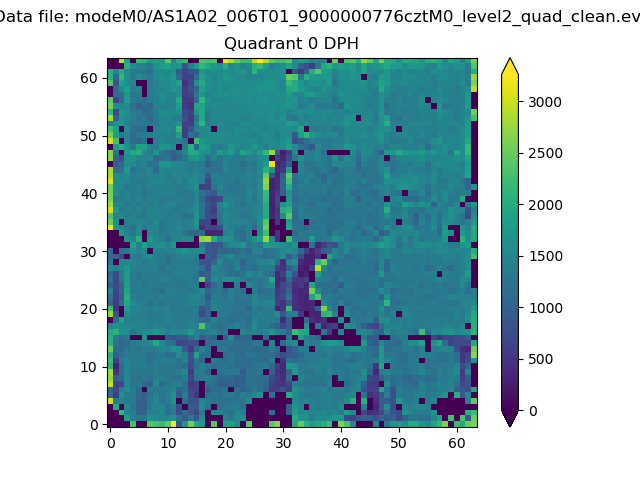 |
 |
Quadrant B |
|---|---|---|---|
| Quadrant D |  |
 |
Quadrant C |
| Plot type | Count rate plots | Images |
|---|---|---|
| Comparison with Poisson distribution Blue bars denote a histogram of data divided into 1 sec bins. Red curve is a Poisson curve with rate = median count rate of data. |
 |
 |
| Quadrant-wise count rates Data is divided into 100 sec bins |
 |
|
| Module-wise count rates for Quadrant A Data is divided into 100 sec bins |
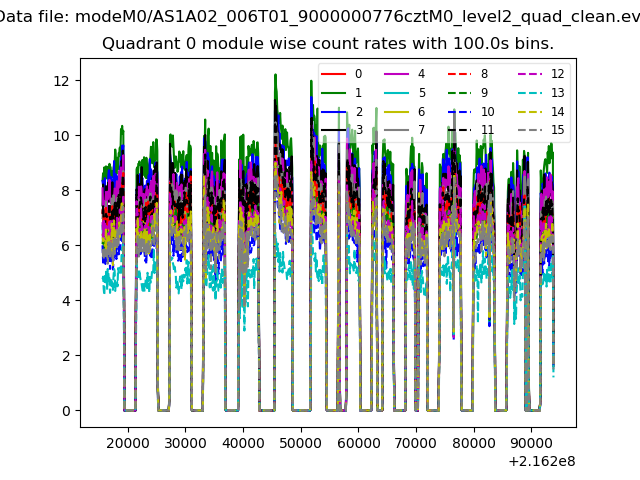 |
 |
| Module-wise count rates for Quadrant B Data is divided into 100 sec bins |
 |
 |
| Module-wise count rates for Quadrant C Data is divided into 100 sec bins |
 |
 |
| Module-wise count rates for Quadrant D Data is divided into 100 sec bins |
 |
 |
| Parameter | Plot |
|---|---|
| CZT HV Monitor |  |
| D_VDD | 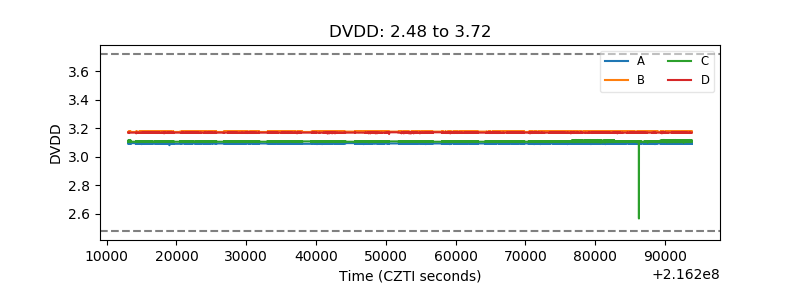 |
| Temperature 1 |  |
| Veto HV Monitor |  |
| Veto LLD |  |
| Alpha Counter |  |
| _CPM_Rate |  |
| CZT Counter |  |
| +2.5 Volts monitor |  |
| +5 Volts monitor |  |
| _ROLL_ROT |  |
| _Roll_DEC |  |
| _Roll_RA |  |
| Veto Counter |  |