| Param | Original file | Final file |
|---|---|---|
| Filename | modeM0/AS1G06_086T01_9000000774cztM0_level2.evt | modeM0/AS1G06_086T01_9000000774cztM0_level2_quad_clean.evt |
| Size (bytes) | 13,331,298,240 | 3,342,024,000 |
| Size | 12.4 GB | 3.1 GB |
| Events in quadrant A | 105,473,366 | 22,070,359 |
| Events in quadrant B | 96,429,776 | 22,928,120 |
| Events in quadrant C | 102,213,851 | 22,068,968 |
| Events in quadrant D | 86,923,475 | 21,273,049 |
| Mode M9 | |||
|---|---|---|---|
| Quadrant | BADHDUFLAG | Total packets | Discarded packets |
| A | 0 | 340 | 0 |
| B | 0 | 334 | 0 |
| C | 0 | 339 | 0 |
| D | 0 | 341 | 0 |
| Mode SS | |||
|---|---|---|---|
| Quadrant | BADHDUFLAG | Total packets | Discarded packets |
| A | 0 | 3928 | 0 |
| B | 0 | 3974 | 0 |
| C | 0 | 3958 | 0 |
| D | 0 | 3916 | 0 |
| Mode M0 | |||
|---|---|---|---|
| Quadrant | BADHDUFLAG | Total packets | Discarded packets |
| A | 0 | 448238 | 0 |
| B | 0 | 416456 | 0 |
| C | 0 | 441239 | 0 |
| D | 0 | 402038 | 0 |
| Quadrant | Total seconds | Saturated seconds | Saturation percentage |
|---|---|---|---|
| A | 187616 | 8543 | 4.553450% |
| B | 187646 | 3727 | 1.986187% |
| C | 188002 | 5557 | 2.955820% |
| D | 187860 | 2618 | 1.393591% |
Noise dominated data is calculated using 1-second bins in cleaned event files. If a bin has >2000 counts, and if more than 50% of those come from <1% of pixels, then it is considered to be noise-dominated and hence unusable.
| Quadrant | # 1 sec bins | Bins with >0 counts | Bins with >2000 counts | High rate bins dominated by noise | Noise dominated (total time) | Noise dominated (detector-on time) | Marked lightcurve |
|---|---|---|---|---|---|---|---|
| A | 309541 | 190286 | 6268 | 6268 | 2.02% | 3.29% |  |
| B | 309541 | 190323 | 1668 | 1668 | 0.54% | 0.88% |  |
| C | 309541 | 190588 | 4033 | 4033 | 1.30% | 2.12% | 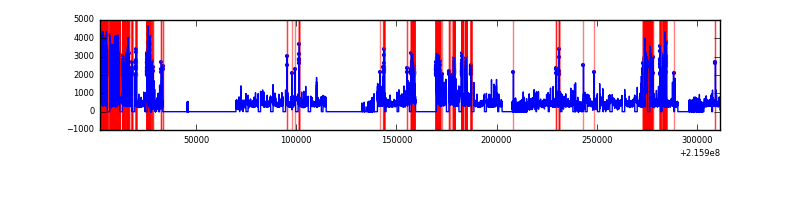 |
| D | 309541 | 190485 | 1319 | 1319 | 0.43% | 0.69% |  |
Top three noisy pixels from each quadrant. If the there are fewer than three noisy pixels in the level2.evt file, extra rows are filled as -1
| Pixel properties | Quadrant properties | ||||||
|---|---|---|---|---|---|---|---|
| Quadrant | DetID | PixID | Counts | Sigma | Mean | Median | Sigma |
| A | 15 | 234 | 18603631 | 4476.54 | 20820 | 20377 | 4151.3 |
| A | 13 | 34 | 2768109 | 661.9 | 20820 | 20377 | 4151.3 |
| A | 4 | 2 | 994222 | 234.59 | 20820 | 20377 | 4151.3 |
| B | 3 | 64 | 6322202 | 1565.54 | 21429 | 20943 | 4025.0 |
| B | 15 | 204 | 1904342 | 467.93 | 21429 | 20943 | 4025.0 |
| B | 0 | 214 | 1137147 | 277.32 | 21429 | 20943 | 4025.0 |
| C | 1 | 241 | 13119709 | 2811.69 | 20428 | 20483 | 4658.8 |
| C | 9 | 247 | 8342688 | 1786.32 | 20428 | 20483 | 4658.8 |
| C | 1 | 16 | 363746 | 73.68 | 20428 | 20483 | 4658.8 |
| D | 2 | 63 | 3158703 | 633.2 | 20483 | 19829 | 4957.2 |
| D | 2 | 206 | 1073400 | 212.53 | 20483 | 19829 | 4957.2 |
| D | 1 | 239 | 1048371 | 207.49 | 20483 | 19829 | 4957.2 |
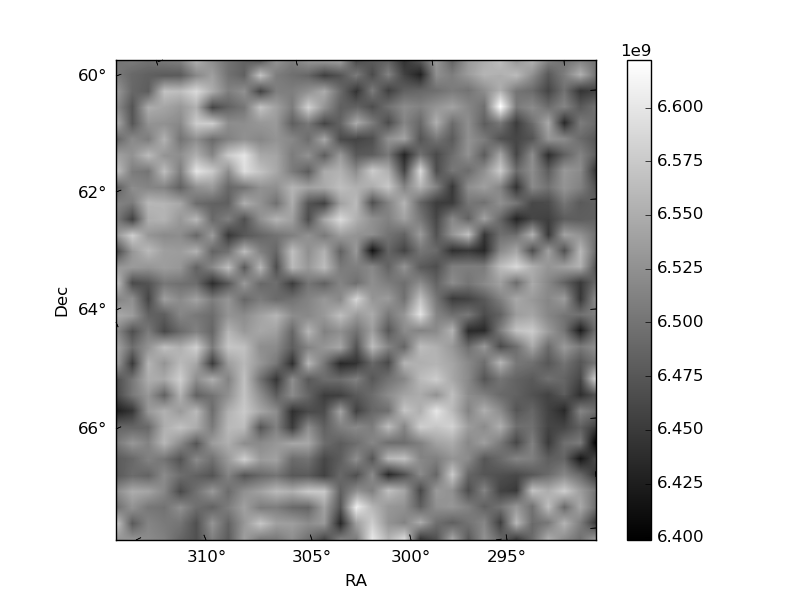
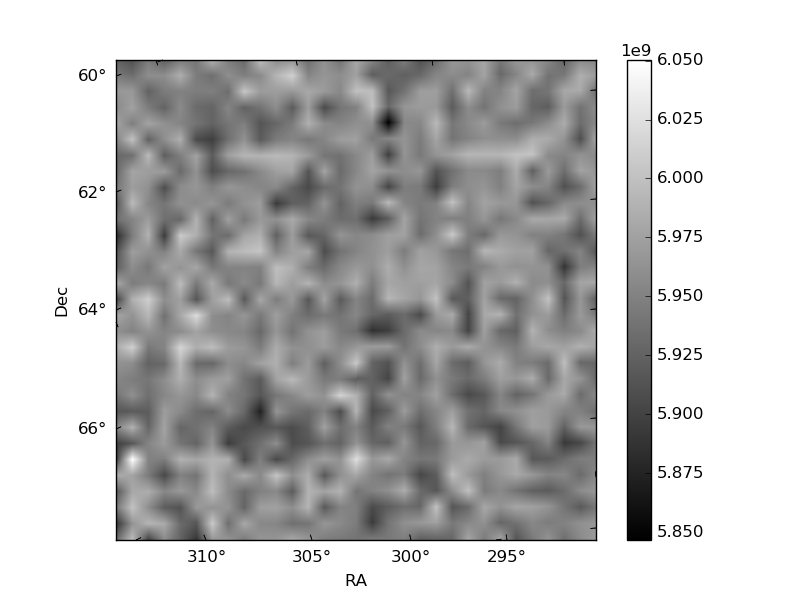
Histogram calculated using DETX and DETY for each event in the final _common_clean file
| Quadrant A |  |
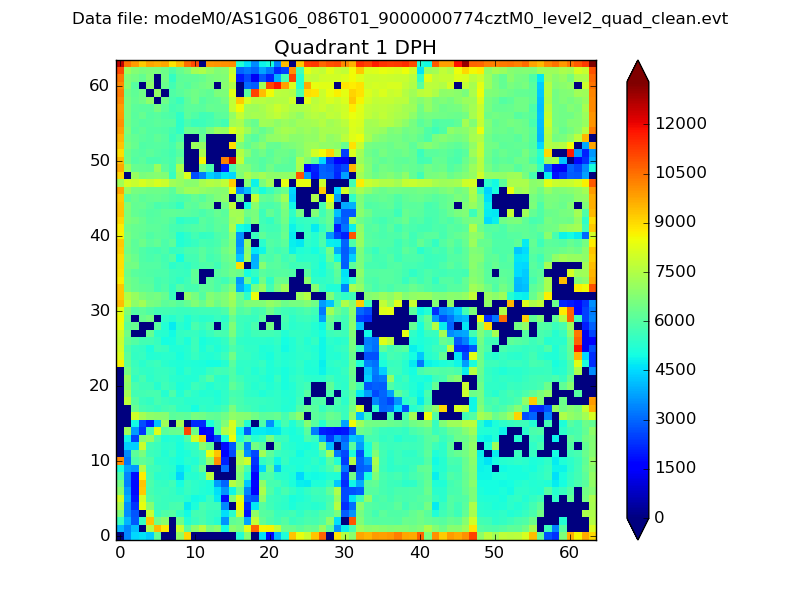 |
Quadrant B |
|---|---|---|---|
| Quadrant D |  |
 |
Quadrant C |
| Plot type | Count rate plots | Images |
|---|---|---|
| Comparison with Poisson distribution Blue bars denote a histogram of data divided into 1 sec bins. Red curve is a Poisson curve with rate = median count rate of data. |
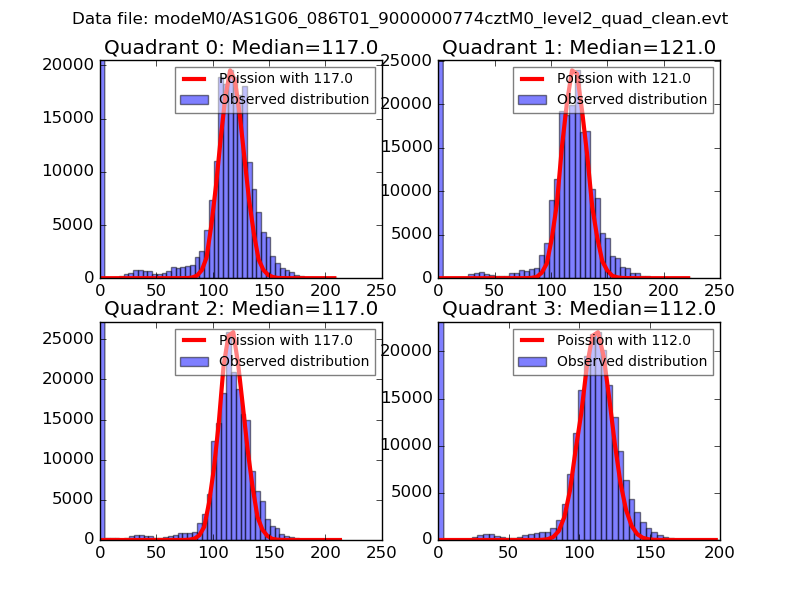 |
 |
| Quadrant-wise count rates Data is divided into 100 sec bins |
 |
|
| Module-wise count rates for Quadrant A Data is divided into 100 sec bins |
 |
 |
| Module-wise count rates for Quadrant B Data is divided into 100 sec bins |
 |
 |
| Module-wise count rates for Quadrant C Data is divided into 100 sec bins |
 |
 |
| Module-wise count rates for Quadrant D Data is divided into 100 sec bins |
 |
 |
| Parameter | Plot |
|---|---|
| CZT HV Monitor |  |
| D_VDD |  |
| Temperature 1 |  |
| Veto HV Monitor | 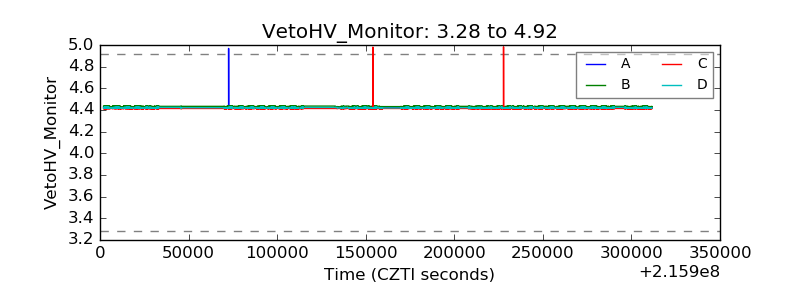 |
| Veto LLD |  |
| Alpha Counter |  |
| _CPM_Rate |  |
| CZT Counter |  |
| +2.5 Volts monitor |  |
| +5 Volts monitor |  |
| _ROLL_ROT |  |
| _Roll_DEC | 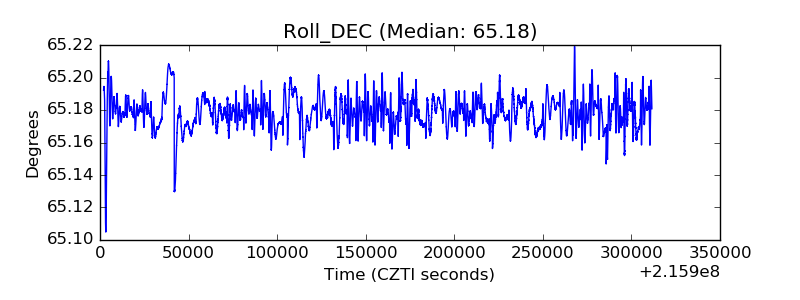 |
| _Roll_RA |  |
| Veto Counter |  |