| Param | Original file | Final file |
|---|---|---|
| Filename | modeM0/AS1G06_157T01_9000000772cztM0_level2.evt | modeM0/AS1G06_157T01_9000000772cztM0_level2_quad_clean.evt |
| Size (bytes) | 6,122,658,240 | 940,567,680 |
| Size | 5.7 GB | 897.0 MB |
| Events in quadrant A | 40,436,548 | 6,095,185 |
| Events in quadrant B | 34,973,005 | 5,718,671 |
| Events in quadrant C | 56,782,317 | 5,752,771 |
| Events in quadrant D | 48,152,110 | 5,750,749 |
| Mode M0 | |||
|---|---|---|---|
| Quadrant | BADHDUFLAG | Total packets | Discarded packets |
| A | 0 | 172459 | 0 |
| B | 0 | 156205 | 0 |
| C | 0 | 222788 | 0 |
| D | 0 | 197396 | 0 |
| Mode M9 | |||
|---|---|---|---|
| Quadrant | BADHDUFLAG | Total packets | Discarded packets |
| A | 0 | 124 | 0 |
| B | 0 | 123 | 0 |
| C | 0 | 125 | 0 |
| D | 0 | 125 | 0 |
| Mode SS | |||
|---|---|---|---|
| Quadrant | BADHDUFLAG | Total packets | Discarded packets |
| A | 0 | 1552 | 0 |
| B | 0 | 1556 | 0 |
| C | 0 | 1558 | 0 |
| D | 0 | 1552 | 0 |
| Quadrant | Total seconds | Saturated seconds | Saturation percentage |
|---|---|---|---|
| A | 75111 | 1760 | 2.343199% |
| B | 75341 | 922 | 1.223769% |
| C | 75397 | 9512 | 12.615887% |
| D | 75184 | 3753 | 4.991754% |
Noise dominated data is calculated using 1-second bins in cleaned event files. If a bin has >2000 counts, and if more than 50% of those come from <1% of pixels, then it is considered to be noise-dominated and hence unusable.
| Quadrant | # 1 sec bins | Bins with >0 counts | Bins with >2000 counts | High rate bins dominated by noise | Noise dominated (total time) | Noise dominated (detector-on time) | Marked lightcurve |
|---|---|---|---|---|---|---|---|
| A | 94001 | 77113 | 665 | 665 | 0.71% | 0.86% | 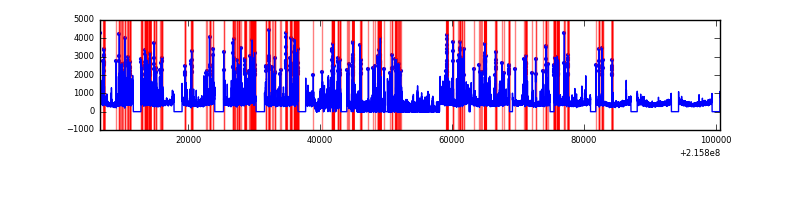 |
| B | 94001 | 77325 | 23 | 23 | 0.02% | 0.03% |  |
| C | 94001 | 77384 | 7336 | 7336 | 7.80% | 9.48% | 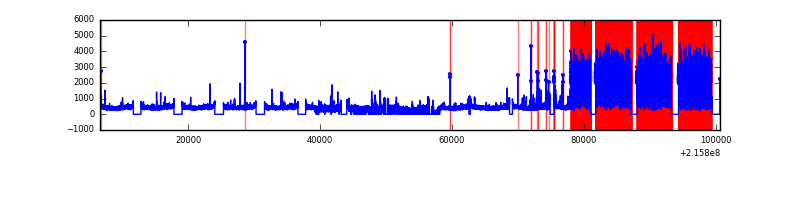 |
| D | 94001 | 77199 | 3106 | 3106 | 3.30% | 4.02% | 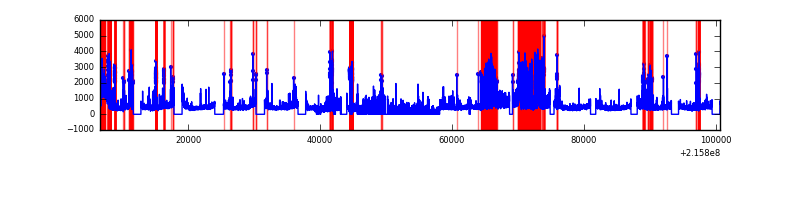 |
Top three noisy pixels from each quadrant. If the there are fewer than three noisy pixels in the level2.evt file, extra rows are filled as -1
| Pixel properties | Quadrant properties | ||||||
|---|---|---|---|---|---|---|---|
| Quadrant | DetID | PixID | Counts | Sigma | Mean | Median | Sigma |
| A | 4 | 2 | 5149766 | 3012.2 | 8479 | 8287 | 1706.9 |
| A | 13 | 251 | 2191973 | 1279.34 | 8479 | 8287 | 1706.9 |
| A | 8 | 192 | 328739 | 187.74 | 8479 | 8287 | 1706.9 |
| B | 0 | 219 | 320305 | 190.2 | 8687 | 8472 | 1639.5 |
| B | 15 | 204 | 277013 | 163.79 | 8687 | 8472 | 1639.5 |
| B | 15 | 255 | 266229 | 157.22 | 8687 | 8472 | 1639.5 |
| C | 9 | 247 | 25471638 | 14009.67 | 7932 | 7962 | 1817.6 |
| C | 9 | 54 | 135372 | 70.1 | 7932 | 7962 | 1817.6 |
| C | 1 | 16 | 98822 | 49.99 | 7932 | 7962 | 1817.6 |
| D | 1 | 20 | 11901361 | 5969.5 | 8215 | 7971 | 1992.4 |
| D | 2 | 63 | 3136497 | 1570.26 | 8215 | 7971 | 1992.4 |
| D | 10 | 172 | 1220976 | 608.83 | 8215 | 7971 | 1992.4 |
Histogram calculated using DETX and DETY for each event in the final _common_clean file
| Quadrant A |  |
 |
Quadrant B |
|---|---|---|---|
| Quadrant D |  |
 |
Quadrant C |
| Plot type | Count rate plots | Images |
|---|---|---|
| Comparison with Poisson distribution Blue bars denote a histogram of data divided into 1 sec bins. Red curve is a Poisson curve with rate = median count rate of data. |
 |
 |
| Quadrant-wise count rates Data is divided into 100 sec bins |
 |
|
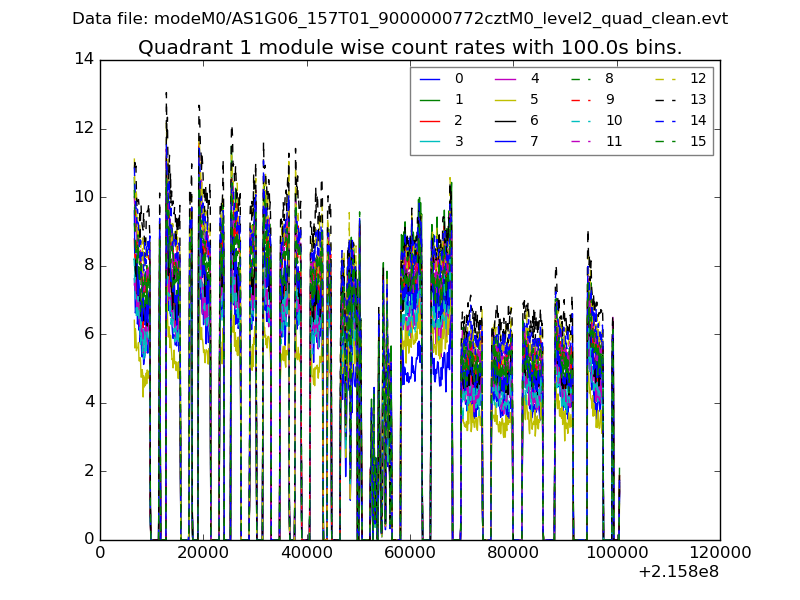
| Module-wise count rates for Quadrant A Data is divided into 100 sec bins |
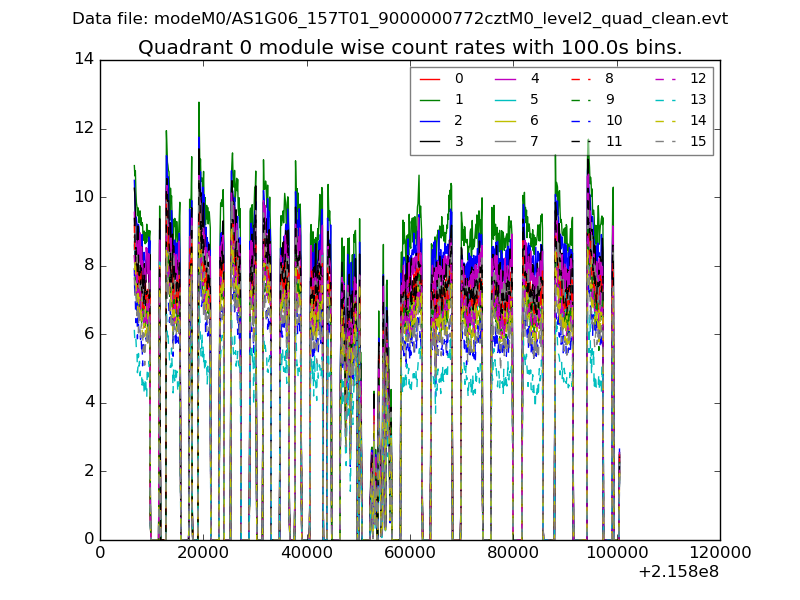 |
 |
| Module-wise count rates for Quadrant B Data is divided into 100 sec bins |
 |
 |
| Module-wise count rates for Quadrant C Data is divided into 100 sec bins |
 |
 |
| Module-wise count rates for Quadrant D Data is divided into 100 sec bins |
 |
 |
| Parameter | Plot |
|---|---|
| CZT HV Monitor |  |
| D_VDD | 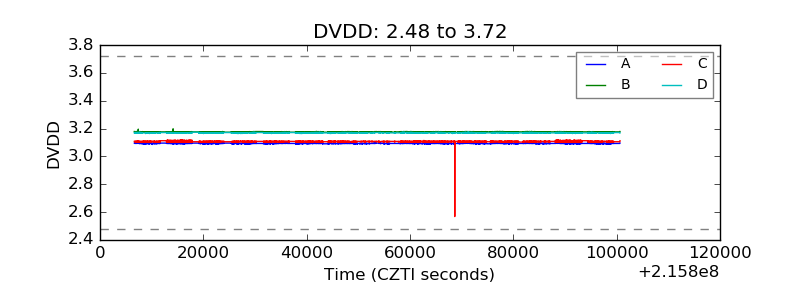 |
| Temperature 1 |  |
| Veto HV Monitor |  |
| Veto LLD |  |
| Alpha Counter |  |
| _CPM_Rate |  |
| CZT Counter |  |
| +2.5 Volts monitor |  |
| +5 Volts monitor | 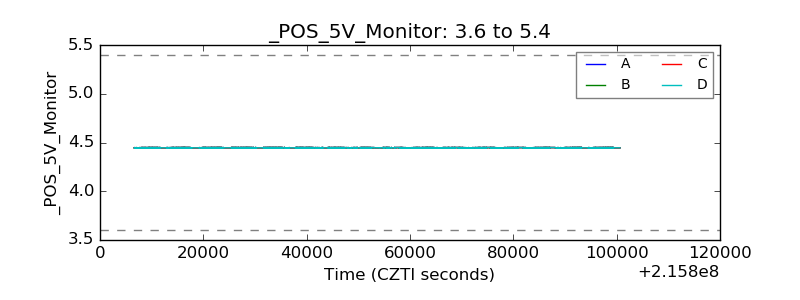 |
| _ROLL_ROT |  |
| _Roll_DEC | 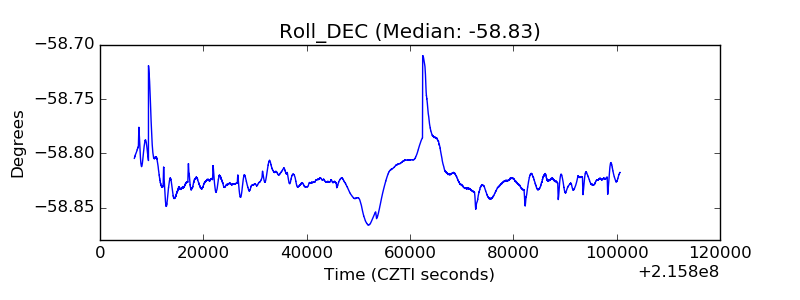 |
| _Roll_RA |  |
| Veto Counter |  |