| Param | Original file | Final file |
|---|---|---|
| Filename | modeM0/AS1G06_028T01_9000000768cztM0_level2.evt | modeM0/AS1G06_028T01_9000000768cztM0_level2_quad_clean.evt |
| Size (bytes) | 2,771,288,640 | 440,444,160 |
| Size | 2.6 GB | 420.0 MB |
| Events in quadrant A | 17,236,724 | 2,767,498 |
| Events in quadrant B | 18,993,837 | 2,779,954 |
| Events in quadrant C | 16,626,151 | 2,760,608 |
| Events in quadrant D | 28,616,165 | 2,531,347 |
| Mode SS | |||
|---|---|---|---|
| Quadrant | BADHDUFLAG | Total packets | Discarded packets |
| A | 0 | 750 | 0 |
| B | 0 | 746 | 0 |
| C | 0 | 748 | 0 |
| D | 0 | 748 | 0 |
| Mode M9 | |||
|---|---|---|---|
| Quadrant | BADHDUFLAG | Total packets | Discarded packets |
| A | 0 | 72 | 0 |
| B | 0 | 72 | 0 |
| C | 0 | 72 | 0 |
| D | 0 | 72 | 0 |
| Mode M0 | |||
|---|---|---|---|
| Quadrant | BADHDUFLAG | Total packets | Discarded packets |
| A | 0 | 76093 | 0 |
| B | 0 | 80865 | 0 |
| C | 0 | 74300 | 0 |
| D | 0 | 109733 | 0 |
| Quadrant | Total seconds | Saturated seconds | Saturation percentage |
|---|---|---|---|
| A | 36382 | 338 | 0.929031% |
| B | 36385 | 496 | 1.363199% |
| C | 36431 | 135 | 0.370564% |
| D | 36328 | 2775 | 7.638736% |
Noise dominated data is calculated using 1-second bins in cleaned event files. If a bin has >2000 counts, and if more than 50% of those come from <1% of pixels, then it is considered to be noise-dominated and hence unusable.
| Quadrant | # 1 sec bins | Bins with >0 counts | Bins with >2000 counts | High rate bins dominated by noise | Noise dominated (total time) | Noise dominated (detector-on time) | Marked lightcurve |
|---|---|---|---|---|---|---|---|
| A | 44083 | 36714 | 146 | 146 | 0.33% | 0.40% |  |
| B | 44083 | 36728 | 188 | 188 | 0.43% | 0.51% |  |
| C | 44083 | 36780 | 1 | 1 | 0.00% | 0.00% |  |
| D | 44083 | 36721 | 2424 | 2424 | 5.50% | 6.60% |  |
Top three noisy pixels from each quadrant. If the there are fewer than three noisy pixels in the level2.evt file, extra rows are filled as -1
| Pixel properties | Quadrant properties | ||||||
|---|---|---|---|---|---|---|---|
| Quadrant | DetID | PixID | Counts | Sigma | Mean | Median | Sigma |
| A | 15 | 234 | 378592 | 432.07 | 4295 | 4214 | 866.5 |
| A | 0 | 50 | 198353 | 224.06 | 4295 | 4214 | 866.5 |
| A | 7 | 16 | 104074 | 115.25 | 4295 | 4214 | 866.5 |
| B | 15 | 204 | 823151 | 1004.26 | 4336 | 4246 | 815.4 |
| B | 15 | 255 | 727484 | 886.94 | 4336 | 4246 | 815.4 |
| B | 0 | 214 | 222876 | 268.12 | 4336 | 4246 | 815.4 |
| C | 9 | 68 | 98272 | 97.39 | 4212 | 4255 | 965.4 |
| C | 14 | 67 | 67734 | 65.75 | 4212 | 4255 | 965.4 |
| C | 13 | 61 | 33437 | 30.23 | 4212 | 4255 | 965.4 |
| D | 2 | 63 | 5840435 | 5828.65 | 4098 | 3984 | 1001.3 |
| D | 1 | 20 | 5458235 | 5446.96 | 4098 | 3984 | 1001.3 |
| D | 8 | 195 | 847964 | 842.85 | 4098 | 3984 | 1001.3 |
Histogram calculated using DETX and DETY for each event in the final _common_clean file
| Quadrant A | 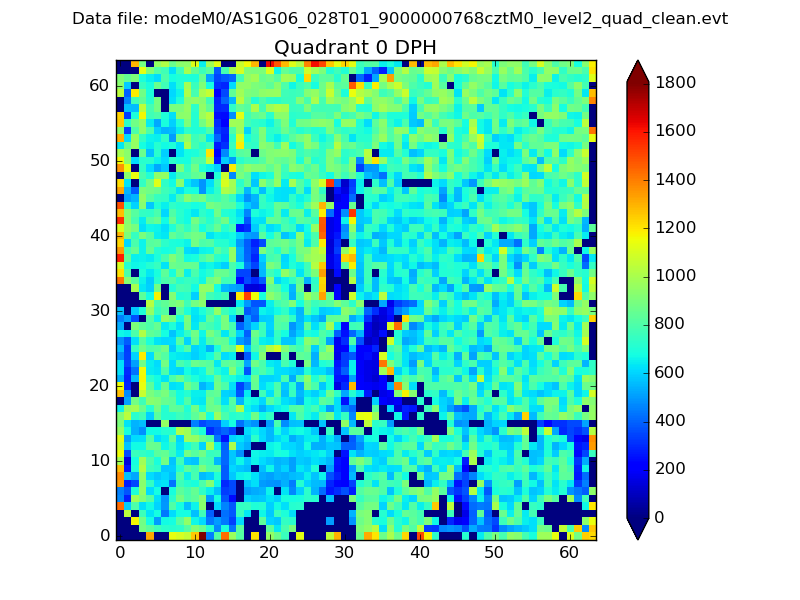 |
 |
Quadrant B |
|---|---|---|---|
| Quadrant D |  |
 |
Quadrant C |
| Plot type | Count rate plots | Images |
|---|---|---|
| Comparison with Poisson distribution Blue bars denote a histogram of data divided into 1 sec bins. Red curve is a Poisson curve with rate = median count rate of data. |
 |
 |
| Quadrant-wise count rates Data is divided into 100 sec bins |
 |
|
| Module-wise count rates for Quadrant A Data is divided into 100 sec bins |
 |
 |
| Module-wise count rates for Quadrant B Data is divided into 100 sec bins |
 |
 |
| Module-wise count rates for Quadrant C Data is divided into 100 sec bins |
 |
 |
| Module-wise count rates for Quadrant D Data is divided into 100 sec bins |
 |
 |
| Parameter | Plot |
|---|---|
| CZT HV Monitor | 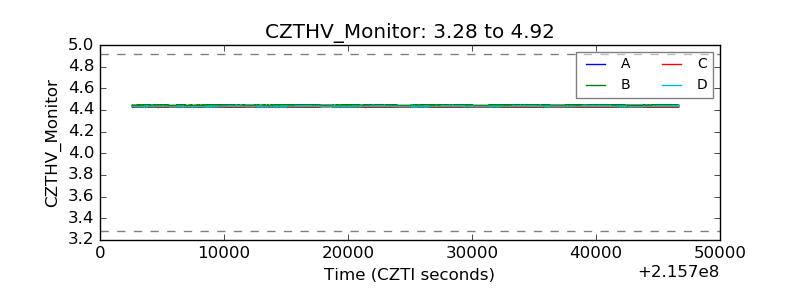 |
| D_VDD |  |
| Temperature 1 |  |
| Veto HV Monitor |  |
| Veto LLD |  |
| Alpha Counter |  |
| _CPM_Rate |  |
| CZT Counter |  |
| +2.5 Volts monitor |  |
| +5 Volts monitor |  |
| _ROLL_ROT |  |
| _Roll_DEC |  |
| _Roll_RA |  |
| Veto Counter |  |