| Param | Original file | Final file |
|---|---|---|
| Filename | modeM0/AS1A02_174T01_9000000766cztM0_level2_bc.evt | modeM0/AS1A02_174T01_9000000766cztM0_level2_quad_clean.evt |
| Size (bytes) | 4,507,387,200 | 1,154,664,000 |
| Size | 4.2 GB | 1.1 GB |
| Events in quadrant A | 6,766,574 | 2,592,082 |
| Events in quadrant B | 28,150,763 | 8,821,044 |
| Events in quadrant C | 25,993,087 | 8,720,266 |
| Events in quadrant D | 68,704,281 | 7,890,277 |
| Mode M9 | |||
|---|---|---|---|
| Quadrant | BADHDUFLAG | Total packets | Discarded packets |
| A | 0 | 182 | 0 |
| B | 0 | 181 | 0 |
| C | 0 | 181 | 0 |
| D | 0 | 182 | 0 |
| Mode M0 | |||
|---|---|---|---|
| Quadrant | BADHDUFLAG | Total packets | Discarded packets |
| A | 0 | 72991 | 0 |
| B | 0 | 266464 | 0 |
| C | 0 | 259152 | 0 |
| D | 0 | 397814 | 0 |
| Mode SS | |||
|---|---|---|---|
| Quadrant | BADHDUFLAG | Total packets | Discarded packets |
| A | 0 | 2474 | 0 |
| B | 0 | 2476 | 0 |
| C | 0 | 2480 | 0 |
| D | 0 | 2488 | 0 |
| Quadrant | Total seconds | Saturated seconds | Saturation percentage |
|---|---|---|---|
| A | 35670 | 241 | 0.675638% |
| B | 121410 | 2681 | 2.208220% |
| C | 121390 | 1747 | 1.439163% |
| D | 121095 | 11217 | 9.262975% |
Noise dominated data is calculated using 1-second bins in cleaned event files. If a bin has >2000 counts, and if more than 50% of those come from <1% of pixels, then it is considered to be noise-dominated and hence unusable.
| Quadrant | # 1 sec bins | Bins with >0 counts | Bins with >2000 counts | High rate bins dominated by noise | Noise dominated (total time) | Noise dominated (detector-on time) | Marked lightcurve |
|---|---|---|---|---|---|---|---|
| A | 45181 | 37004 | 6 | 6 | 0.01% | 0.02% |  |
| B | 143543 | 123518 | 61 | 61 | 0.04% | 0.05% |  |
| C | 143543 | 123440 | 126 | 126 | 0.09% | 0.10% |  |
| D | 143543 | 123350 | 3866 | 3866 | 2.69% | 3.13% |  |
Top three noisy pixels from each quadrant. If the there are fewer than three noisy pixels in the level2.evt file, extra rows are filled as -1
| Pixel properties | Quadrant properties | ||||||
|---|---|---|---|---|---|---|---|
| Quadrant | DetID | PixID | Counts | Sigma | Mean | Median | Sigma |
| A | 15 | 234 | 63646 | 164.91 | 1719 | 1679 | 375.8 |
| A | 15 | 236 | 52408 | 135.0 | 1719 | 1679 | 375.8 |
| A | 7 | 16 | 17846 | 43.02 | 1719 | 1679 | 375.8 |
| B | 15 | 255 | 2042973 | 1840.55 | 5847 | 5678 | 1106.9 |
| B | 0 | 214 | 791854 | 710.25 | 5847 | 5678 | 1106.9 |
| B | 15 | 204 | 706199 | 632.87 | 5847 | 5678 | 1106.9 |
| C | 9 | 247 | 3261909 | 2572.35 | 5709 | 5611 | 1265.9 |
| C | 1 | 16 | 217484 | 167.37 | 5709 | 5611 | 1265.9 |
| C | 9 | 68 | 50478 | 35.44 | 5709 | 5611 | 1265.9 |
| D | 1 | 20 | 32417364 | 24164.63 | 5536 | 5301 | 1341.3 |
| D | 2 | 152 | 5789635 | 4312.48 | 5536 | 5301 | 1341.3 |
| D | 2 | 63 | 2529467 | 1881.88 | 5536 | 5301 | 1341.3 |
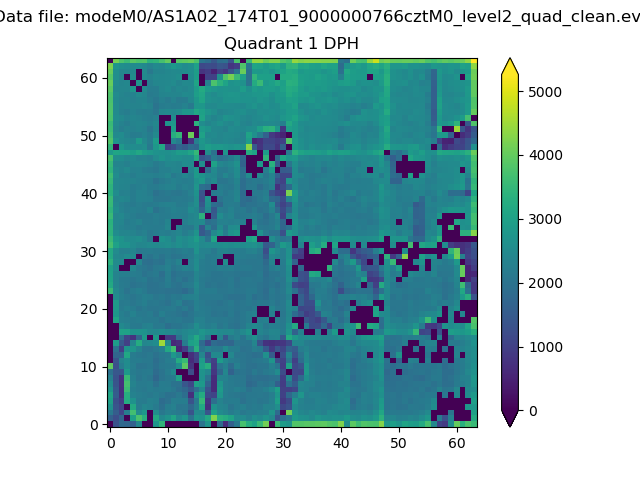
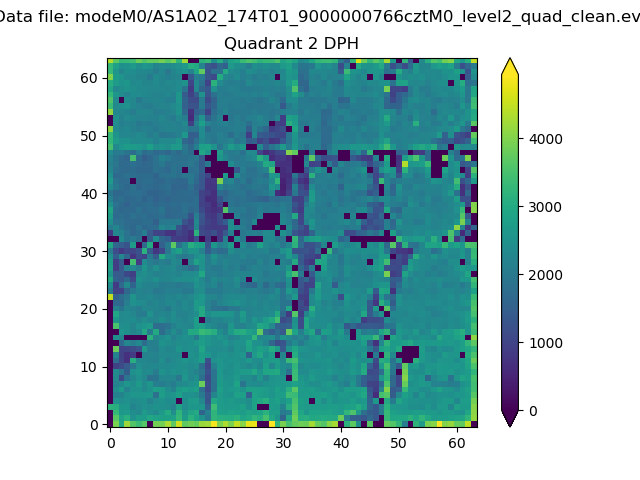
Histogram calculated using DETX and DETY for each event in the final _common_clean file
| Quadrant A |  |
 |
Quadrant B |
|---|---|---|---|
| Quadrant D | 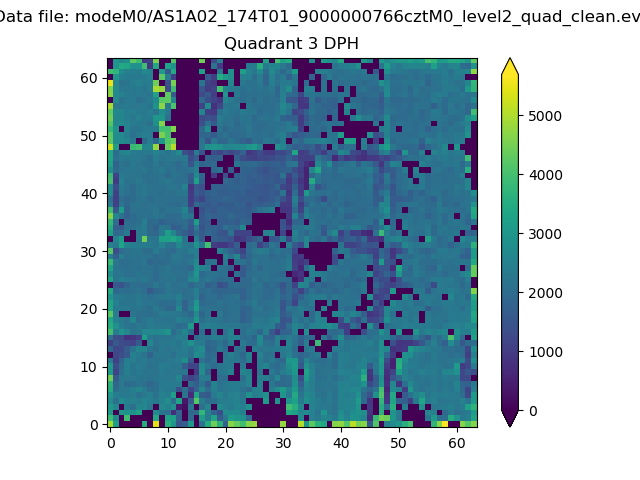 |
 |
Quadrant C |
| Plot type | Count rate plots | Images |
|---|---|---|
| Comparison with Poisson distribution Blue bars denote a histogram of data divided into 1 sec bins. Red curve is a Poisson curve with rate = median count rate of data. |
 |
 |
| Quadrant-wise count rates Data is divided into 100 sec bins |
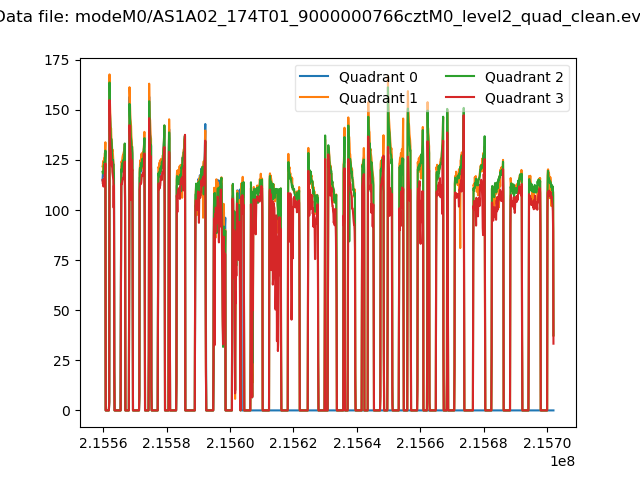 |
|
| Module-wise count rates for Quadrant A Data is divided into 100 sec bins |
 |
 |
| Module-wise count rates for Quadrant B Data is divided into 100 sec bins |
 |
 |
| Module-wise count rates for Quadrant C Data is divided into 100 sec bins |
 |
 |
| Module-wise count rates for Quadrant D Data is divided into 100 sec bins |
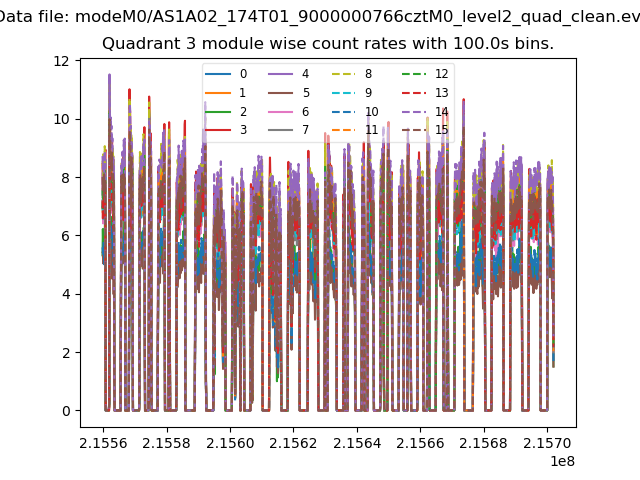 |
 |
| Parameter | Plot |
|---|---|
| CZT HV Monitor | 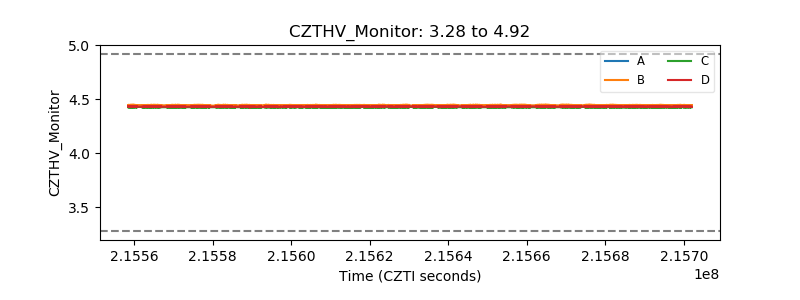 |
| D_VDD |  |
| Temperature 1 | 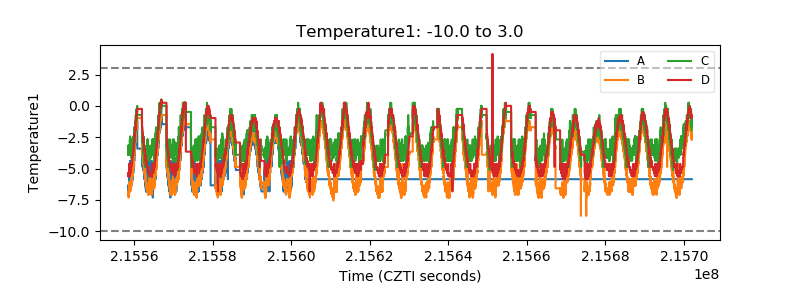 |
| Veto HV Monitor |  |
| Veto LLD |  |
| Alpha Counter |  |
| _CPM_Rate | 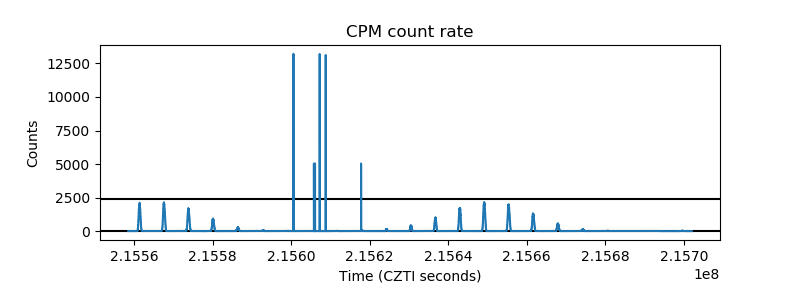 |
| CZT Counter |  |
| +2.5 Volts monitor | 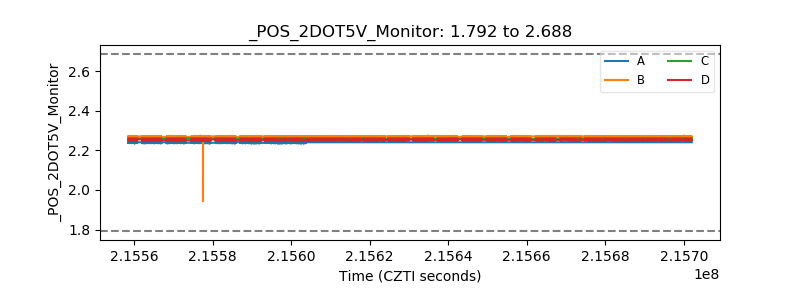 |
| +5 Volts monitor |  |
| _ROLL_ROT | 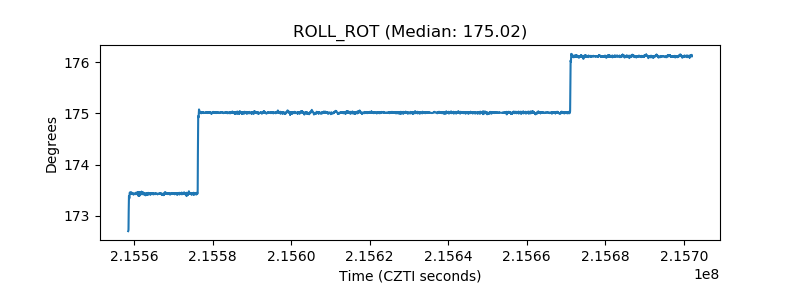 |
| _Roll_DEC | 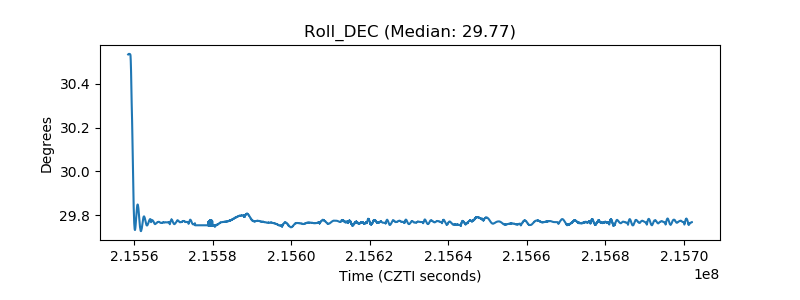 |
| _Roll_RA |  |
| Veto Counter |  |