| Param | Original file | Final file |
|---|---|---|
| Filename | modeM0/AS1A02_114T01_9000000764cztM0_level2.evt | modeM0/AS1A02_114T01_9000000764cztM0_level2_quad_clean.evt |
| Size (bytes) | 4,212,622,080 | 770,843,520 |
| Size | 3.9 GB | 735.1 MB |
| Events in quadrant A | 28,860,394 | 4,777,083 |
| Events in quadrant B | 29,980,900 | 4,854,614 |
| Events in quadrant C | 28,190,433 | 4,806,732 |
| Events in quadrant D | 36,280,084 | 4,574,869 |
| Mode M0 | |||
|---|---|---|---|
| Quadrant | BADHDUFLAG | Total packets | Discarded packets |
| A | 0 | 130200 | 0 |
| B | 0 | 132065 | 0 |
| C | 0 | 129675 | 0 |
| D | 0 | 152223 | 0 |
| Mode M9 | |||
|---|---|---|---|
| Quadrant | BADHDUFLAG | Total packets | Discarded packets |
| A | 0 | 87 | 0 |
| B | 0 | 87 | 0 |
| C | 0 | 87 | 0 |
| D | 0 | 88 | 0 |
| Mode SS | |||
|---|---|---|---|
| Quadrant | BADHDUFLAG | Total packets | Discarded packets |
| A | 0 | 1286 | 0 |
| B | 0 | 1288 | 0 |
| C | 0 | 1288 | 0 |
| D | 0 | 1288 | 0 |
| Quadrant | Total seconds | Saturated seconds | Saturation percentage |
|---|---|---|---|
| A | 63183 | 1035 | 1.638099% |
| B | 63186 | 1165 | 1.843763% |
| C | 63205 | 775 | 1.226169% |
| D | 63189 | 1631 | 2.581145% |
Noise dominated data is calculated using 1-second bins in cleaned event files. If a bin has >2000 counts, and if more than 50% of those come from <1% of pixels, then it is considered to be noise-dominated and hence unusable.
| Quadrant | # 1 sec bins | Bins with >0 counts | Bins with >2000 counts | High rate bins dominated by noise | Noise dominated (total time) | Noise dominated (detector-on time) | Marked lightcurve |
|---|---|---|---|---|---|---|---|
| A | 81520 | 63242 | 6 | 6 | 0.01% | 0.01% |  |
| B | 81520 | 63243 | 37 | 37 | 0.05% | 0.06% |  |
| C | 81520 | 63244 | 2 | 2 | 0.00% | 0.00% | 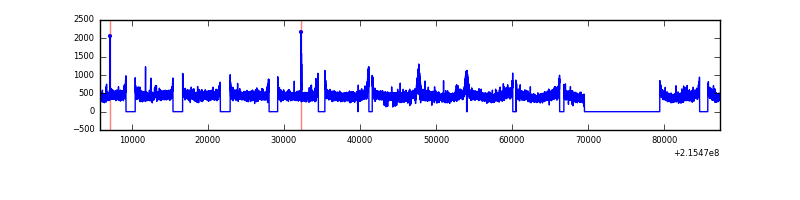 |
| D | 81520 | 63245 | 581 | 581 | 0.71% | 0.92% |  |
Top three noisy pixels from each quadrant. If the there are fewer than three noisy pixels in the level2.evt file, extra rows are filled as -1
| Pixel properties | Quadrant properties | ||||||
|---|---|---|---|---|---|---|---|
| Quadrant | DetID | PixID | Counts | Sigma | Mean | Median | Sigma |
| A | 15 | 236 | 592250 | 399.95 | 7289 | 7127 | 1463.0 |
| A | 15 | 234 | 121978 | 78.5 | 7289 | 7127 | 1463.0 |
| A | 12 | 194 | 69585 | 42.69 | 7289 | 7127 | 1463.0 |
| B | 15 | 204 | 833522 | 590.0 | 7392 | 7200 | 1400.5 |
| B | 15 | 255 | 318802 | 222.49 | 7392 | 7200 | 1400.5 |
| B | 12 | 111 | 138609 | 93.83 | 7392 | 7200 | 1400.5 |
| C | 13 | 61 | 57125 | 30.19 | 7180 | 7202 | 1653.6 |
| C | 14 | 206 | 38923 | 19.18 | 7180 | 7202 | 1653.6 |
| C | 8 | 128 | 38622 | 19.0 | 7180 | 7202 | 1653.6 |
| D | 1 | 20 | 2698895 | 1564.59 | 7113 | 6894 | 1720.6 |
| D | 2 | 152 | 2229451 | 1291.75 | 7113 | 6894 | 1720.6 |
| D | 12 | 233 | 1636128 | 946.91 | 7113 | 6894 | 1720.6 |
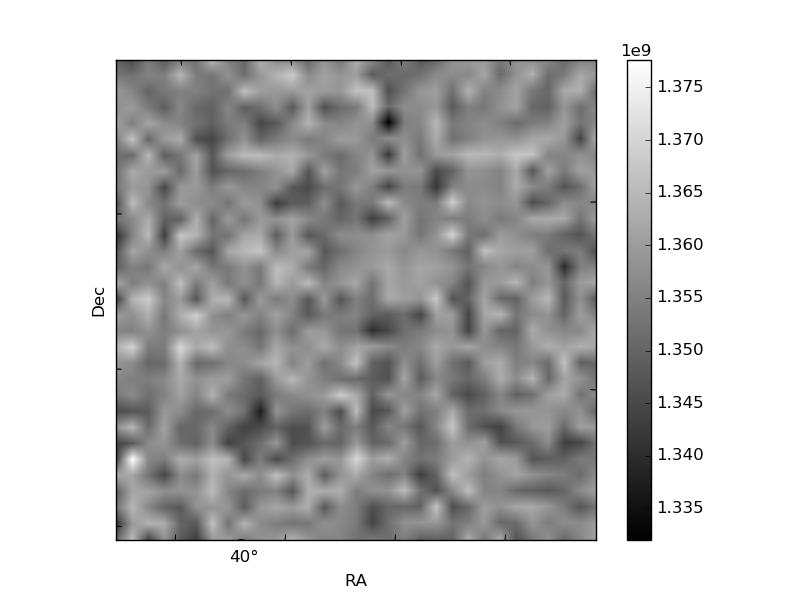
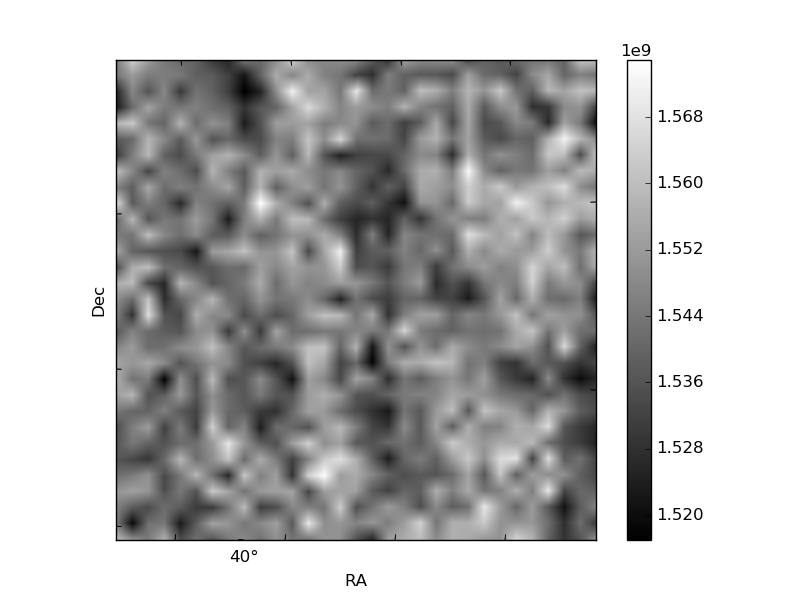
Histogram calculated using DETX and DETY for each event in the final _common_clean file
| Quadrant A |  |
 |
Quadrant B |
|---|---|---|---|
| Quadrant D | 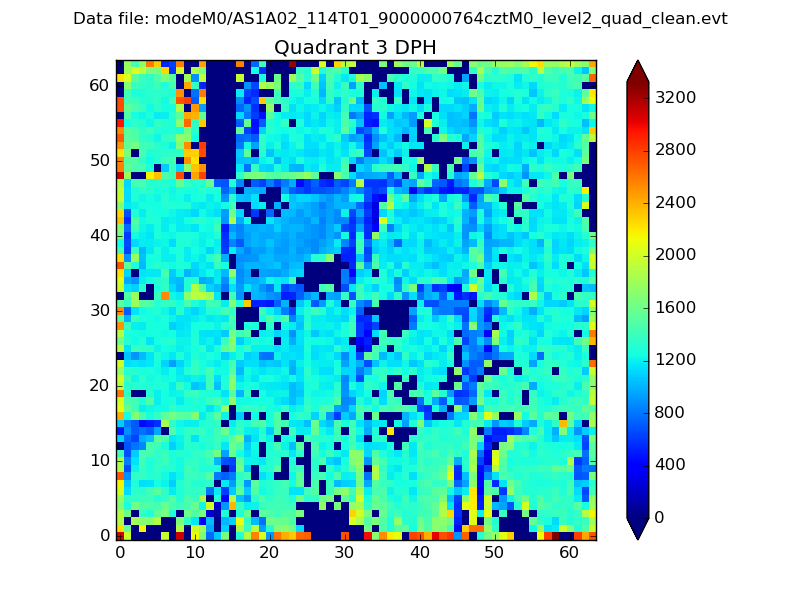 |
 |
Quadrant C |
| Plot type | Count rate plots | Images |
|---|---|---|
| Comparison with Poisson distribution Blue bars denote a histogram of data divided into 1 sec bins. Red curve is a Poisson curve with rate = median count rate of data. |
 |
 |
| Quadrant-wise count rates Data is divided into 100 sec bins |
 |
|
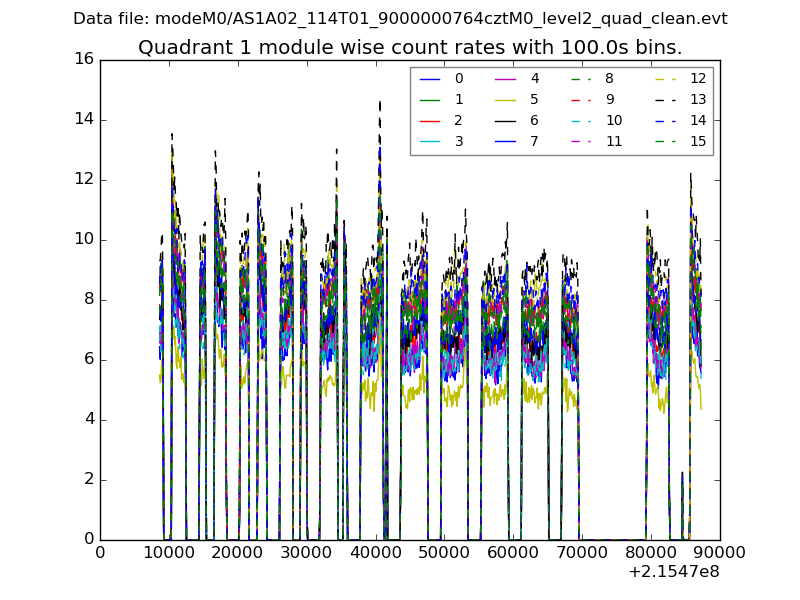
| Module-wise count rates for Quadrant A Data is divided into 100 sec bins |
 |
 |
| Module-wise count rates for Quadrant B Data is divided into 100 sec bins |
 |
 |
| Module-wise count rates for Quadrant C Data is divided into 100 sec bins |
 |
 |
| Module-wise count rates for Quadrant D Data is divided into 100 sec bins |
 |
 |
| Parameter | Plot |
|---|---|
| CZT HV Monitor |  |
| D_VDD | 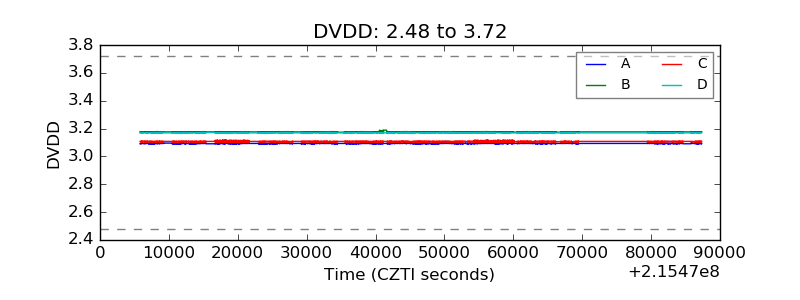 |
| Temperature 1 | 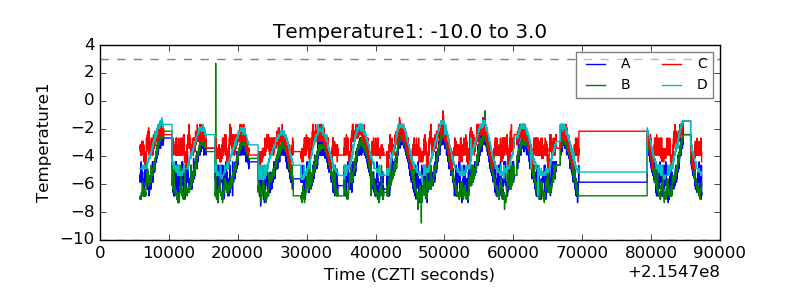 |
| Veto HV Monitor |  |
| Veto LLD |  |
| Alpha Counter | 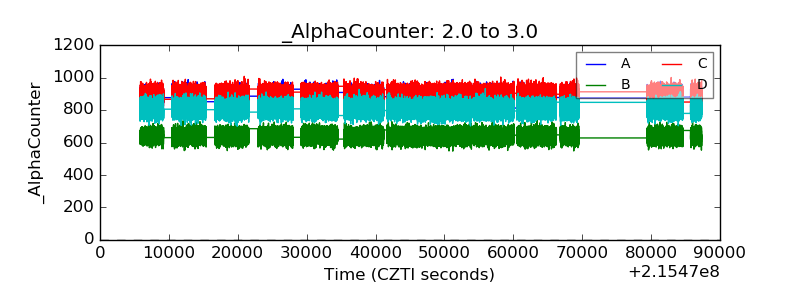 |
| _CPM_Rate |  |
| CZT Counter |  |
| +2.5 Volts monitor | 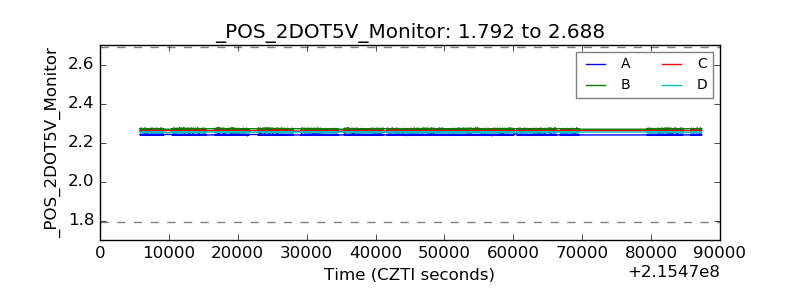 |
| +5 Volts monitor |  |
| _ROLL_ROT |  |
| _Roll_DEC |  |
| _Roll_RA |  |
| Veto Counter |  |