| Param | Original file | Final file |
|---|---|---|
| Filename | modeM0/AS1G06_023T01_9000000762cztM0_level2.evt | modeM0/AS1G06_023T01_9000000762cztM0_level2_quad_clean.evt |
| Size (bytes) | 5,919,367,680 | 1,003,492,800 |
| Size | 5.5 GB | 957.0 MB |
| Events in quadrant A | 34,617,109 | 6,673,990 |
| Events in quadrant B | 34,946,758 | 6,778,662 |
| Events in quadrant C | 31,426,137 | 6,550,185 |
| Events in quadrant D | 73,433,212 | 5,458,081 |
| Mode M0 | |||
|---|---|---|---|
| Quadrant | BADHDUFLAG | Total packets | Discarded packets |
| A | 0 | 155181 | 0 |
| B | 0 | 154098 | 0 |
| C | 0 | 147576 | 0 |
| D | 0 | 268834 | 0 |
| Mode M9 | |||
|---|---|---|---|
| Quadrant | BADHDUFLAG | Total packets | Discarded packets |
| A | 0 | 114 | 0 |
| B | 0 | 114 | 0 |
| C | 0 | 114 | 0 |
| D | 0 | 114 | 0 |
| Mode SS | |||
|---|---|---|---|
| Quadrant | BADHDUFLAG | Total packets | Discarded packets |
| A | 0 | 1460 | 0 |
| B | 0 | 1460 | 0 |
| C | 0 | 1460 | 0 |
| D | 0 | 1460 | 0 |
| Quadrant | Total seconds | Saturated seconds | Saturation percentage |
|---|---|---|---|
| A | 71911 | 943 | 1.311343% |
| B | 71917 | 1056 | 1.468359% |
| C | 71924 | 571 | 0.793894% |
| D | 71898 | 13440 | 18.693149% |
Noise dominated data is calculated using 1-second bins in cleaned event files. If a bin has >2000 counts, and if more than 50% of those come from <1% of pixels, then it is considered to be noise-dominated and hence unusable.
| Quadrant | # 1 sec bins | Bins with >0 counts | Bins with >2000 counts | High rate bins dominated by noise | Noise dominated (total time) | Noise dominated (detector-on time) | Marked lightcurve |
|---|---|---|---|---|---|---|---|
| A | 83150 | 71952 | 28 | 28 | 0.03% | 0.04% |  |
| B | 83150 | 71953 | 86 | 86 | 0.10% | 0.12% |  |
| C | 83150 | 71955 | 17 | 17 | 0.02% | 0.02% |  |
| D | 83149 | 71947 | 11361 | 11361 | 13.66% | 15.79% |  |
Top three noisy pixels from each quadrant. If the there are fewer than three noisy pixels in the level2.evt file, extra rows are filled as -1
| Pixel properties | Quadrant properties | ||||||
|---|---|---|---|---|---|---|---|
| Quadrant | DetID | PixID | Counts | Sigma | Mean | Median | Sigma |
| A | 15 | 236 | 2885320 | 1754.43 | 8165 | 8001 | 1640.0 |
| A | 15 | 234 | 174978 | 101.81 | 8165 | 8001 | 1640.0 |
| A | 0 | 226 | 79470 | 43.58 | 8165 | 8001 | 1640.0 |
| B | 4 | 200 | 634912 | 406.93 | 8263 | 8075 | 1540.4 |
| B | 15 | 204 | 624560 | 400.21 | 8263 | 8075 | 1540.4 |
| B | 4 | 81 | 365279 | 231.89 | 8263 | 8075 | 1540.4 |
| C | 1 | 16 | 313686 | 167.03 | 7946 | 7960 | 1830.4 |
| C | 13 | 61 | 64393 | 30.83 | 7946 | 7960 | 1830.4 |
| C | 1 | 241 | 49284 | 22.58 | 7946 | 7960 | 1830.4 |
| D | 2 | 152 | 35873595 | 20469.29 | 7256 | 7047 | 1752.2 |
| D | 1 | 20 | 4033838 | 2298.12 | 7256 | 7047 | 1752.2 |
| D | 2 | 136 | 1739153 | 988.53 | 7256 | 7047 | 1752.2 |
Histogram calculated using DETX and DETY for each event in the final _common_clean file
| Quadrant A |  |
 |
Quadrant B |
|---|---|---|---|
| Quadrant D | 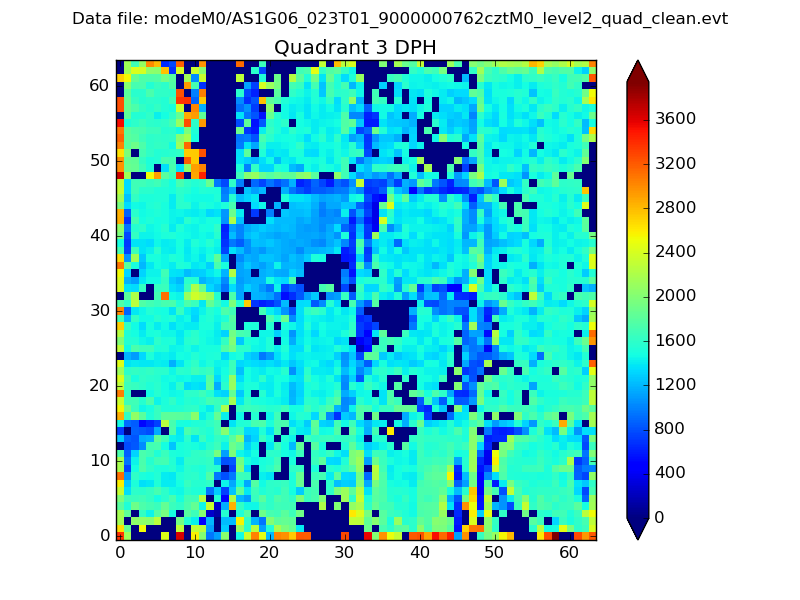 |
 |
Quadrant C |
| Plot type | Count rate plots | Images |
|---|---|---|
| Comparison with Poisson distribution Blue bars denote a histogram of data divided into 1 sec bins. Red curve is a Poisson curve with rate = median count rate of data. |
 |
 |
| Quadrant-wise count rates Data is divided into 100 sec bins |
 |
|
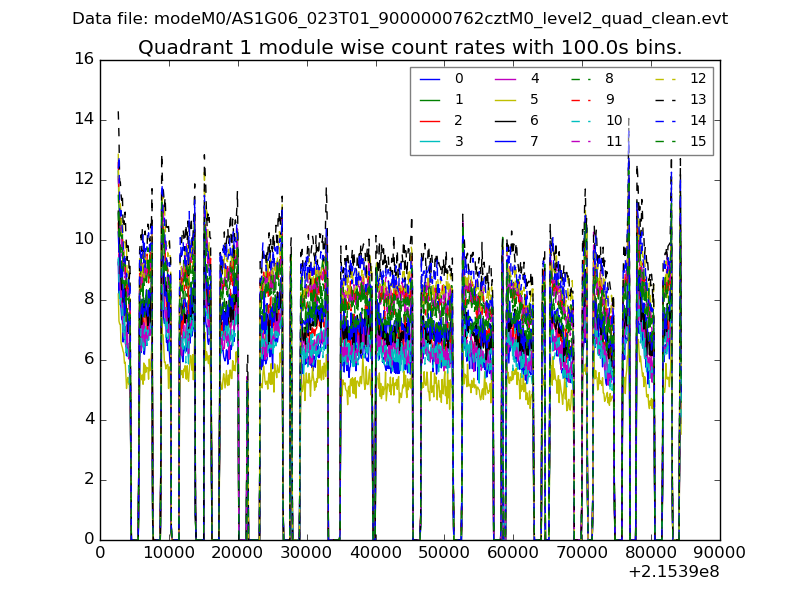
| Module-wise count rates for Quadrant A Data is divided into 100 sec bins |
 |
 |
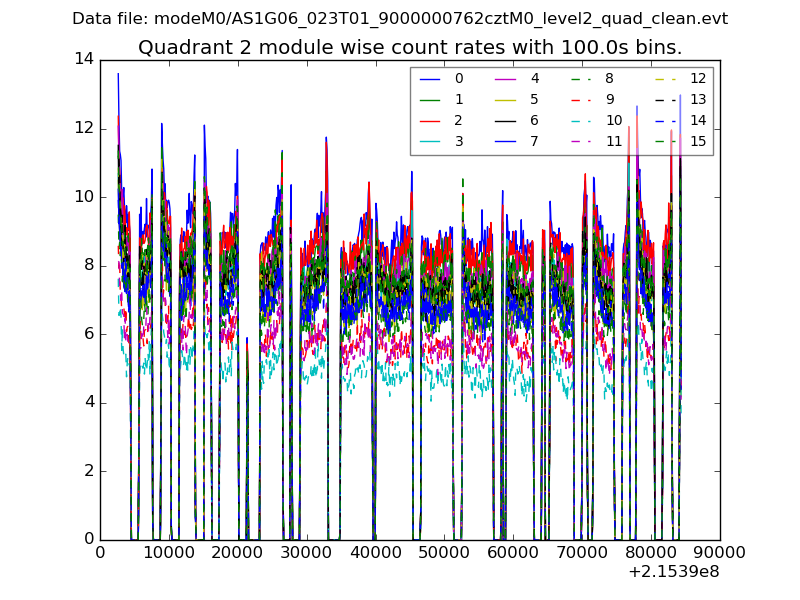
| Module-wise count rates for Quadrant B Data is divided into 100 sec bins |
 |
 |
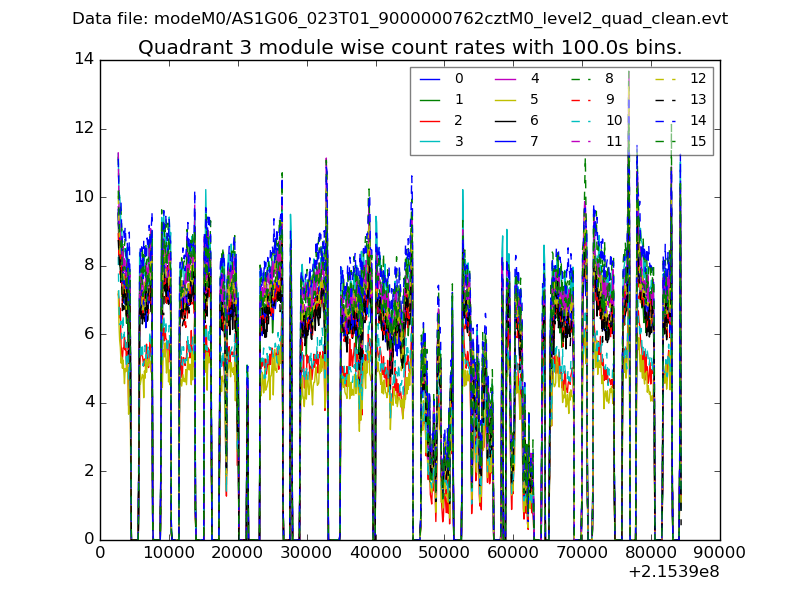
| Module-wise count rates for Quadrant C Data is divided into 100 sec bins |
 |
 |
| Module-wise count rates for Quadrant D Data is divided into 100 sec bins |
 |
 |
| Parameter | Plot |
|---|---|
| CZT HV Monitor |  |
| D_VDD |  |
| Temperature 1 |  |
| Veto HV Monitor |  |
| Veto LLD |  |
| Alpha Counter |  |
| _CPM_Rate | 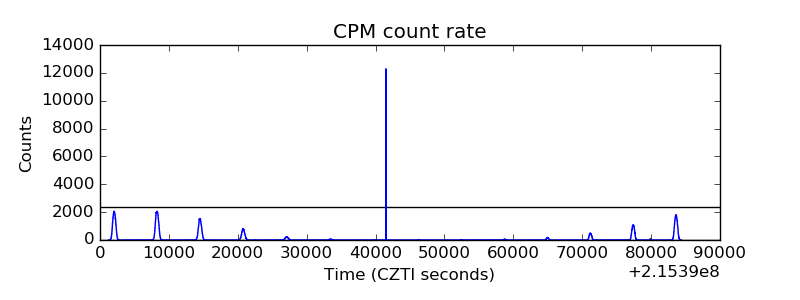 |
| CZT Counter |  |
| +2.5 Volts monitor |  |
| +5 Volts monitor |  |
| _ROLL_ROT |  |
| _Roll_DEC | 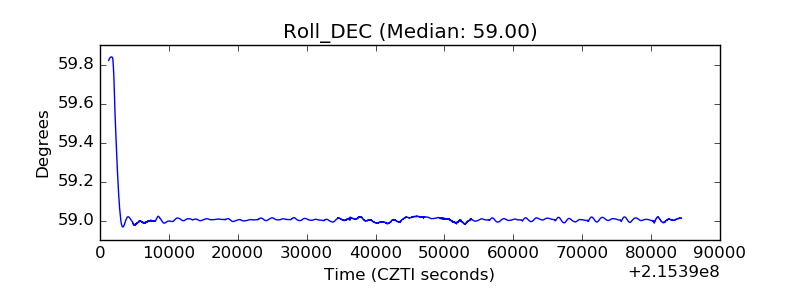 |
| _Roll_RA |  |
| Veto Counter | 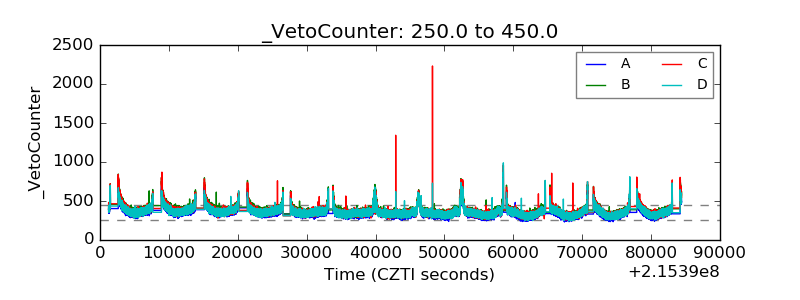 |