| Param | Original file | Final file |
|---|---|---|
| Filename | modeM0/AS1G06_033T01_9000000760cztM0_level2.evt | modeM0/AS1G06_033T01_9000000760cztM0_level2_quad_clean.evt |
| Size (bytes) | 6,383,007,360 | 1,050,537,600 |
| Size | 5.9 GB | 1001.9 MB |
| Events in quadrant A | 41,939,929 | 6,487,887 |
| Events in quadrant B | 43,936,092 | 6,558,483 |
| Events in quadrant C | 41,239,467 | 6,519,636 |
| Events in quadrant D | 60,069,889 | 6,029,833 |
| Mode M0 | |||
|---|---|---|---|
| Quadrant | BADHDUFLAG | Total packets | Discarded packets |
| A | 0 | 187147 | 0 |
| B | 0 | 190110 | 0 |
| C | 0 | 186338 | 0 |
| D | 0 | 239743 | 0 |
| Mode SS | |||
|---|---|---|---|
| Quadrant | BADHDUFLAG | Total packets | Discarded packets |
| A | 0 | 1846 | 0 |
| B | 0 | 1838 | 0 |
| C | 0 | 1846 | 0 |
| D | 0 | 1846 | 0 |
| Mode M9 | |||
|---|---|---|---|
| Quadrant | BADHDUFLAG | Total packets | Discarded packets |
| A | 0 | 130 | 0 |
| B | 0 | 129 | 0 |
| C | 0 | 130 | 0 |
| D | 0 | 130 | 0 |
| Quadrant | Total seconds | Saturated seconds | Saturation percentage |
|---|---|---|---|
| A | 90816 | 1118 | 1.231061% |
| B | 90799 | 1270 | 1.398694% |
| C | 90814 | 612 | 0.673905% |
| D | 90676 | 4500 | 4.962724% |
Noise dominated data is calculated using 1-second bins in cleaned event files. If a bin has >2000 counts, and if more than 50% of those come from <1% of pixels, then it is considered to be noise-dominated and hence unusable.
| Quadrant | # 1 sec bins | Bins with >0 counts | Bins with >2000 counts | High rate bins dominated by noise | Noise dominated (total time) | Noise dominated (detector-on time) | Marked lightcurve |
|---|---|---|---|---|---|---|---|
| A | 104218 | 91196 | 27 | 27 | 0.03% | 0.03% |  |
| B | 104218 | 91184 | 39 | 39 | 0.04% | 0.04% | 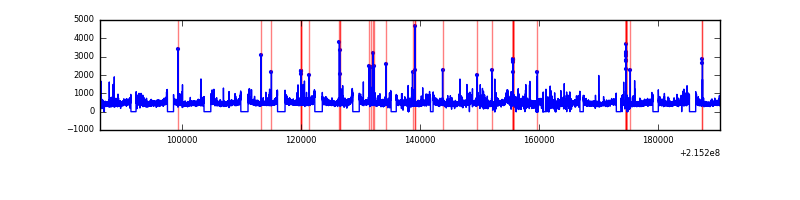 |
| C | 104218 | 91198 | 1 | 1 | 0.00% | 0.00% |  |
| D | 104218 | 91145 | 3115 | 3115 | 2.99% | 3.42% |  |
Top three noisy pixels from each quadrant. If the there are fewer than three noisy pixels in the level2.evt file, extra rows are filled as -1
| Pixel properties | Quadrant properties | ||||||
|---|---|---|---|---|---|---|---|
| Quadrant | DetID | PixID | Counts | Sigma | Mean | Median | Sigma |
| A | 15 | 234 | 134627 | 56.92 | 10799 | 10587 | 2179.3 |
| A | 15 | 236 | 128873 | 54.28 | 10799 | 10587 | 2179.3 |
| A | 0 | 226 | 105220 | 43.42 | 10799 | 10587 | 2179.3 |
| B | 15 | 204 | 667090 | 318.48 | 10901 | 10669 | 2061.1 |
| B | 0 | 219 | 262901 | 122.38 | 10901 | 10669 | 2061.1 |
| B | 0 | 214 | 253520 | 117.82 | 10901 | 10669 | 2061.1 |
| C | 1 | 241 | 133414 | 50.59 | 10489 | 10564 | 2428.3 |
| C | 13 | 61 | 85786 | 30.98 | 10489 | 10564 | 2428.3 |
| C | 8 | 128 | 55093 | 18.34 | 10489 | 10564 | 2428.3 |
| D | 1 | 20 | 7453513 | 2971.23 | 10247 | 9956 | 2505.2 |
| D | 2 | 152 | 6229656 | 2482.71 | 10247 | 9956 | 2505.2 |
| D | 2 | 136 | 1462664 | 579.88 | 10247 | 9956 | 2505.2 |
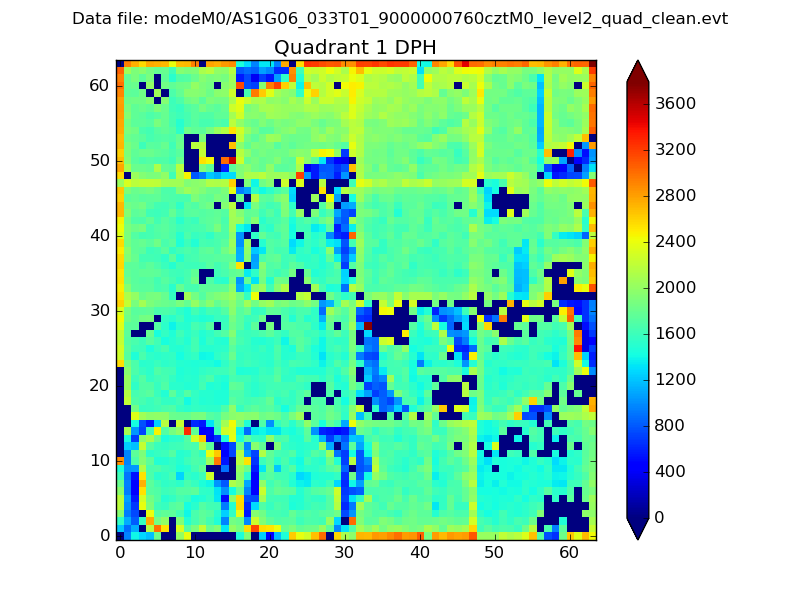
Histogram calculated using DETX and DETY for each event in the final _common_clean file
| Quadrant A |  |
 |
Quadrant B |
|---|---|---|---|
| Quadrant D |  |
 |
Quadrant C |
| Plot type | Count rate plots | Images |
|---|---|---|
| Comparison with Poisson distribution Blue bars denote a histogram of data divided into 1 sec bins. Red curve is a Poisson curve with rate = median count rate of data. |
 |
 |
| Quadrant-wise count rates Data is divided into 100 sec bins |
 |
|
| Module-wise count rates for Quadrant A Data is divided into 100 sec bins |
 |
 |
| Module-wise count rates for Quadrant B Data is divided into 100 sec bins |
 |
 |
| Module-wise count rates for Quadrant C Data is divided into 100 sec bins |
 |
 |
| Module-wise count rates for Quadrant D Data is divided into 100 sec bins |
 |
 |
| Parameter | Plot |
|---|---|
| CZT HV Monitor |  |
| D_VDD |  |
| Temperature 1 | 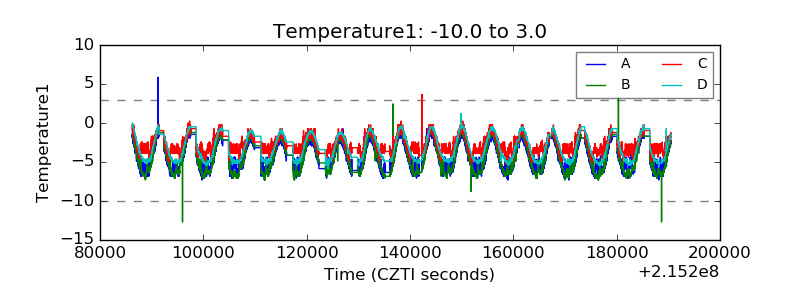 |
| Veto HV Monitor | 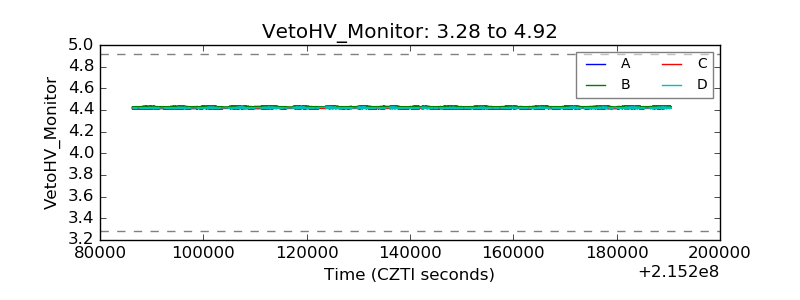 |
| Veto LLD |  |
| Alpha Counter |  |
| _CPM_Rate |  |
| CZT Counter |  |
| +2.5 Volts monitor |  |
| +5 Volts monitor | 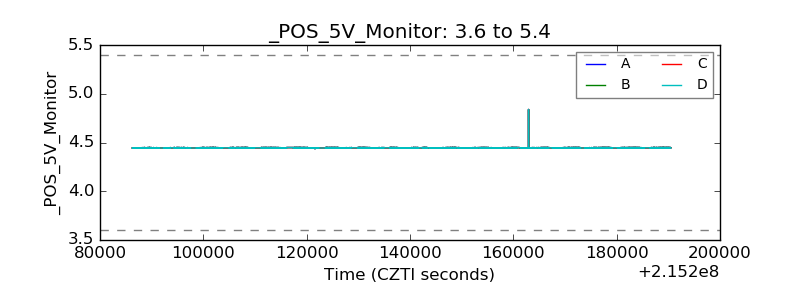 |
| _ROLL_ROT |  |
| _Roll_DEC | 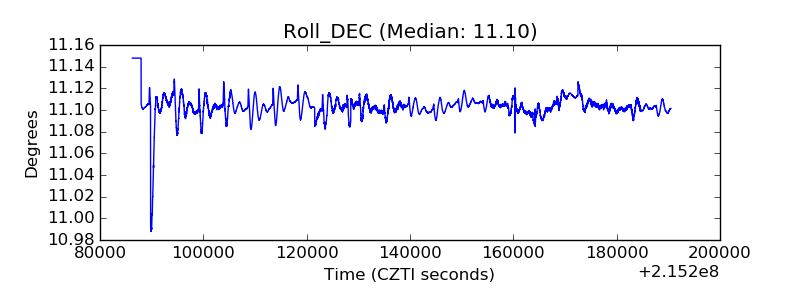 |
| _Roll_RA |  |
| Veto Counter |  |