| Param | Original file | Final file |
|---|---|---|
| Filename | modeM0/AS1A02_197T05_9000000756cztM0_level2.evt | modeM0/AS1A02_197T05_9000000756cztM0_level2_quad_clean.evt |
| Size (bytes) | 1,013,149,440 | 186,125,760 |
| Size | 966.2 MB | 177.5 MB |
| Events in quadrant A | 7,331,022 | 1,145,802 |
| Events in quadrant B | 7,607,927 | 1,166,870 |
| Events in quadrant C | 7,071,235 | 1,146,254 |
| Events in quadrant D | 7,610,648 | 1,096,466 |
| Mode M9 | |||
|---|---|---|---|
| Quadrant | BADHDUFLAG | Total packets | Discarded packets |
| A | 0 | 11 | 0 |
| B | 0 | 11 | 0 |
| C | 0 | 11 | 0 |
| D | 0 | 11 | 0 |
| Mode SS | |||
|---|---|---|---|
| Quadrant | BADHDUFLAG | Total packets | Discarded packets |
| A | 0 | 316 | 0 |
| B | 0 | 320 | 0 |
| C | 0 | 321 | 0 |
| D | 0 | 310 | 0 |
| Mode M0 | |||
|---|---|---|---|
| Quadrant | BADHDUFLAG | Total packets | Discarded packets |
| A | 0 | 33084 | 0 |
| B | 0 | 33052 | 0 |
| C | 0 | 32396 | 0 |
| D | 0 | 33885 | 0 |
| Quadrant | Total seconds | Saturated seconds | Saturation percentage |
|---|---|---|---|
| A | 15696 | 243 | 1.548165% |
| B | 15713 | 199 | 1.266467% |
| C | 15673 | 151 | 0.963440% |
| D | 15665 | 215 | 1.372486% |
Noise dominated data is calculated using 1-second bins in cleaned event files. If a bin has >2000 counts, and if more than 50% of those come from <1% of pixels, then it is considered to be noise-dominated and hence unusable.
| Quadrant | # 1 sec bins | Bins with >0 counts | Bins with >2000 counts | High rate bins dominated by noise | Noise dominated (total time) | Noise dominated (detector-on time) | Marked lightcurve |
|---|---|---|---|---|---|---|---|
| A | 17107 | 16008 | 33 | 33 | 0.19% | 0.21% |  |
| B | 17107 | 15986 | 2 | 2 | 0.01% | 0.01% |  |
| C | 17107 | 15992 | 7 | 7 | 0.04% | 0.04% |  |
| D | 17107 | 15978 | 56 | 56 | 0.33% | 0.35% | 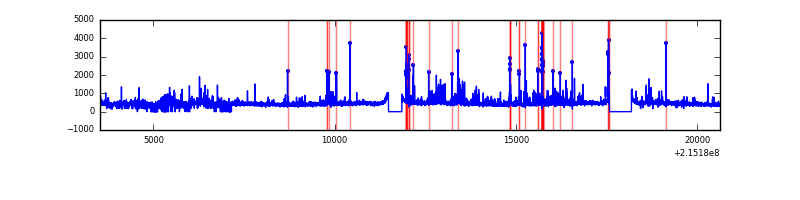 |
Top three noisy pixels from each quadrant. If the there are fewer than three noisy pixels in the level2.evt file, extra rows are filled as -1
| Pixel properties | Quadrant properties | ||||||
|---|---|---|---|---|---|---|---|
| Quadrant | DetID | PixID | Counts | Sigma | Mean | Median | Sigma |
| A | 15 | 234 | 334179 | 901.65 | 1798 | 1752 | 368.7 |
| A | 0 | 50 | 41414 | 107.57 | 1798 | 1752 | 368.7 |
| A | 12 | 194 | 17646 | 43.11 | 1798 | 1752 | 368.7 |
| B | 15 | 204 | 333587 | 950.94 | 1820 | 1776 | 348.9 |
| B | 0 | 214 | 90298 | 253.7 | 1820 | 1776 | 348.9 |
| B | 15 | 85 | 72630 | 203.06 | 1820 | 1776 | 348.9 |
| C | 1 | 16 | 160323 | 388.41 | 1757 | 1763 | 408.2 |
| C | 8 | 128 | 21321 | 47.91 | 1757 | 1763 | 408.2 |
| C | 13 | 61 | 13941 | 29.83 | 1757 | 1763 | 408.2 |
| D | 2 | 152 | 653342 | 1524.42 | 1748 | 1691 | 427.5 |
| D | 11 | 241 | 74018 | 169.2 | 1748 | 1691 | 427.5 |
| D | 10 | 15 | 67684 | 154.38 | 1748 | 1691 | 427.5 |
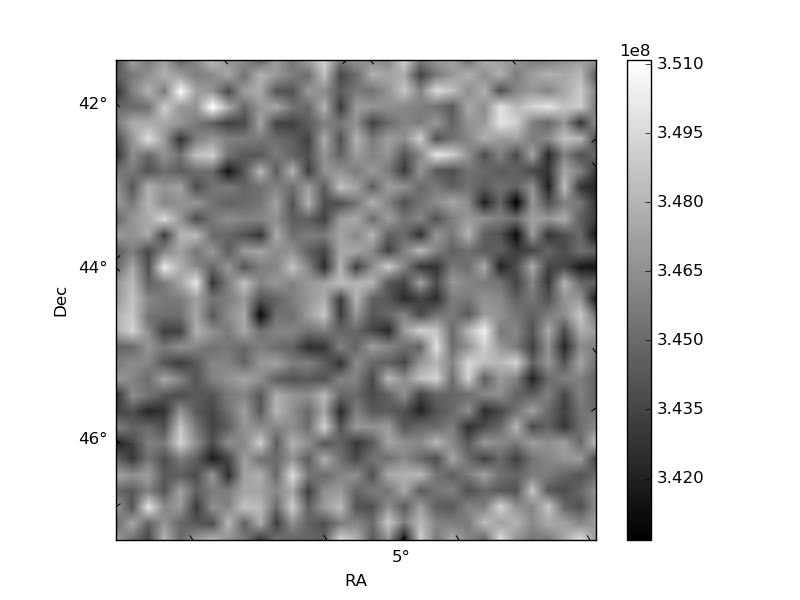
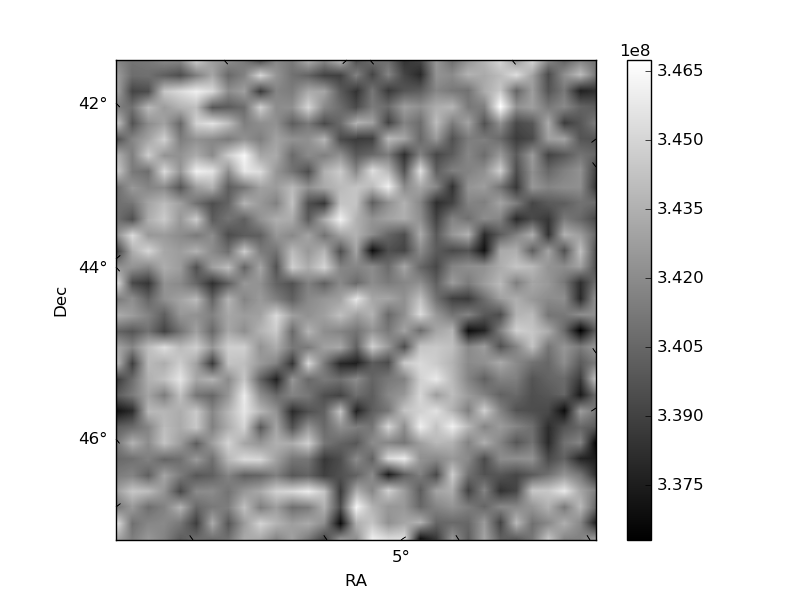
Histogram calculated using DETX and DETY for each event in the final _common_clean file
| Quadrant A |  |
 |
Quadrant B |
|---|---|---|---|
| Quadrant D |  |
 |
Quadrant C |
| Plot type | Count rate plots | Images |
|---|---|---|
| Comparison with Poisson distribution Blue bars denote a histogram of data divided into 1 sec bins. Red curve is a Poisson curve with rate = median count rate of data. |
 |
 |
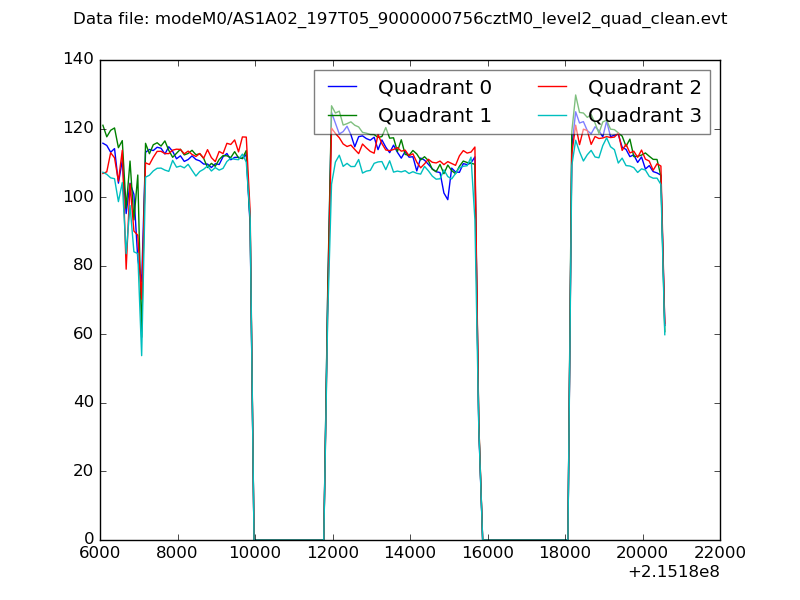
| Quadrant-wise count rates Data is divided into 100 sec bins |
 |
|
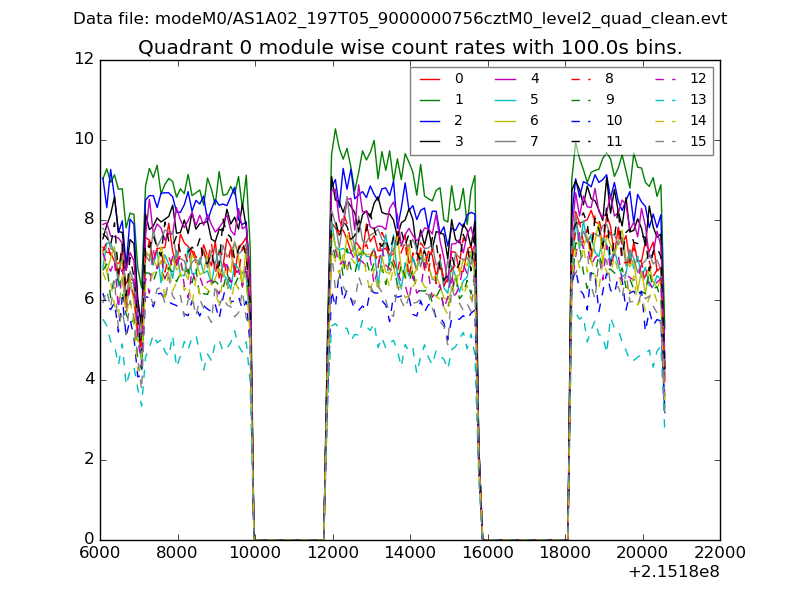
| Module-wise count rates for Quadrant A Data is divided into 100 sec bins |
 |
 |
| Module-wise count rates for Quadrant B Data is divided into 100 sec bins |
 |
 |
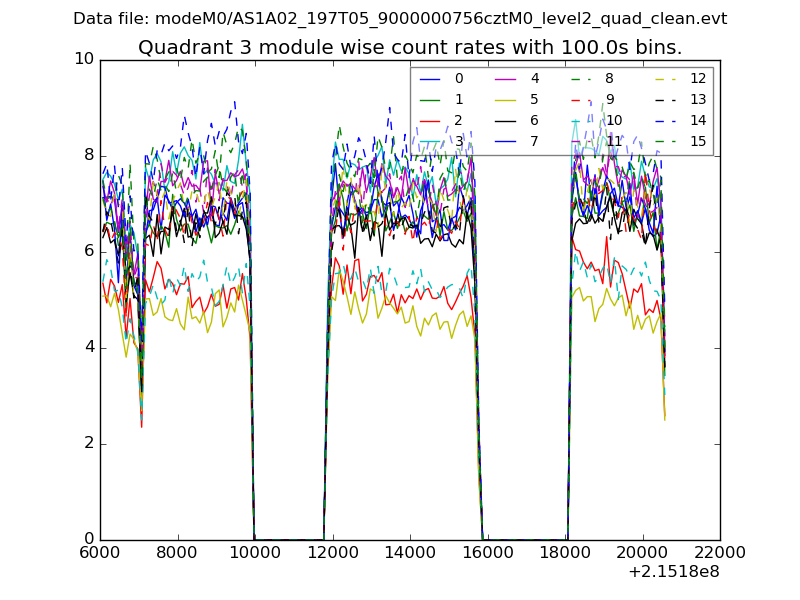
| Module-wise count rates for Quadrant C Data is divided into 100 sec bins |
 |
 |
| Module-wise count rates for Quadrant D Data is divided into 100 sec bins |
 |
 |
| Parameter | Plot |
|---|---|
| CZT HV Monitor |  |
| D_VDD |  |
| Temperature 1 |  |
| Veto HV Monitor |  |
| Veto LLD |  |
| Alpha Counter |  |
| _CPM_Rate |  |
| CZT Counter |  |
| +2.5 Volts monitor |  |
| +5 Volts monitor |  |
| _ROLL_ROT |  |
| _Roll_DEC |  |
| _Roll_RA |  |
| Veto Counter |  |