| Param | Original file | Final file |
|---|---|---|
| Filename | modeM0/AS1G06_168T07_9000000750cztM0_level2.evt | modeM0/AS1G06_168T07_9000000750cztM0_level2_quad_clean.evt |
| Size (bytes) | 1,927,491,840 | 319,959,360 |
| Size | 1.8 GB | 305.1 MB |
| Events in quadrant A | 15,463,900 | 1,946,014 |
| Events in quadrant B | 12,750,720 | 2,016,600 |
| Events in quadrant C | 12,397,489 | 2,001,358 |
| Events in quadrant D | 15,933,694 | 1,864,400 |
| Mode SS | |||
|---|---|---|---|
| Quadrant | BADHDUFLAG | Total packets | Discarded packets |
| A | 0 | 550 | 0 |
| B | 0 | 552 | 0 |
| C | 0 | 552 | 0 |
| D | 0 | 552 | 0 |
| Mode M9 | |||
|---|---|---|---|
| Quadrant | BADHDUFLAG | Total packets | Discarded packets |
| A | 0 | 63 | 0 |
| B | 0 | 63 | 0 |
| C | 0 | 63 | 0 |
| D | 0 | 63 | 0 |
| Mode M0 | |||
|---|---|---|---|
| Quadrant | BADHDUFLAG | Total packets | Discarded packets |
| A | 0 | 64313 | 0 |
| B | 0 | 55438 | 0 |
| C | 0 | 55214 | 0 |
| D | 0 | 65773 | 0 |
| Quadrant | Total seconds | Saturated seconds | Saturation percentage |
|---|---|---|---|
| A | 27081 | 187 | 0.690521% |
| B | 27085 | 134 | 0.494739% |
| C | 27089 | 126 | 0.465133% |
| D | 27088 | 711 | 2.624778% |
Noise dominated data is calculated using 1-second bins in cleaned event files. If a bin has >2000 counts, and if more than 50% of those come from <1% of pixels, then it is considered to be noise-dominated and hence unusable.
| Quadrant | # 1 sec bins | Bins with >0 counts | Bins with >2000 counts | High rate bins dominated by noise | Noise dominated (total time) | Noise dominated (detector-on time) | Marked lightcurve |
|---|---|---|---|---|---|---|---|
| A | 33339 | 27142 | 44 | 44 | 0.13% | 0.16% | 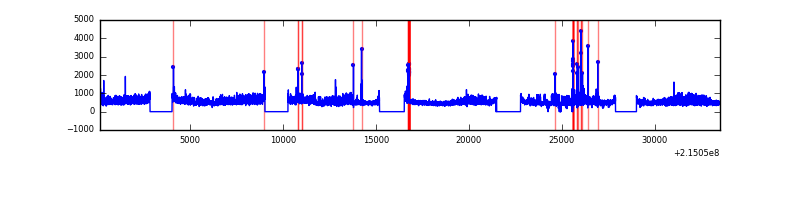 |
| B | 33339 | 27149 | 2 | 2 | 0.01% | 0.01% |  |
| C | 33339 | 27137 | 0 | 0 | 0.00% | 0.00% |  |
| D | 33339 | 27142 | 576 | 576 | 1.73% | 2.12% |  |
Top three noisy pixels from each quadrant. If the there are fewer than three noisy pixels in the level2.evt file, extra rows are filled as -1
| Pixel properties | Quadrant properties | ||||||
|---|---|---|---|---|---|---|---|
| Quadrant | DetID | PixID | Counts | Sigma | Mean | Median | Sigma |
| A | 15 | 236 | 2636788 | 4137.82 | 3180 | 3111 | 636.5 |
| A | 15 | 79 | 382148 | 595.51 | 3180 | 3111 | 636.5 |
| A | 15 | 223 | 170576 | 263.11 | 3180 | 3111 | 636.5 |
| B | 15 | 204 | 134085 | 218.76 | 3230 | 3150 | 598.5 |
| B | 12 | 111 | 55720 | 87.83 | 3230 | 3150 | 598.5 |
| B | 11 | 111 | 44165 | 68.53 | 3230 | 3150 | 598.5 |
| C | 9 | 16 | 65948 | 87.69 | 3151 | 3165 | 715.9 |
| C | 13 | 61 | 25149 | 30.71 | 3151 | 3165 | 715.9 |
| C | 14 | 67 | 12477 | 13.01 | 3151 | 3165 | 715.9 |
| D | 8 | 230 | 3325980 | 4396.92 | 3108 | 3020 | 755.7 |
| D | 11 | 241 | 481139 | 632.64 | 3108 | 3020 | 755.7 |
| D | 8 | 195 | 108797 | 139.96 | 3108 | 3020 | 755.7 |
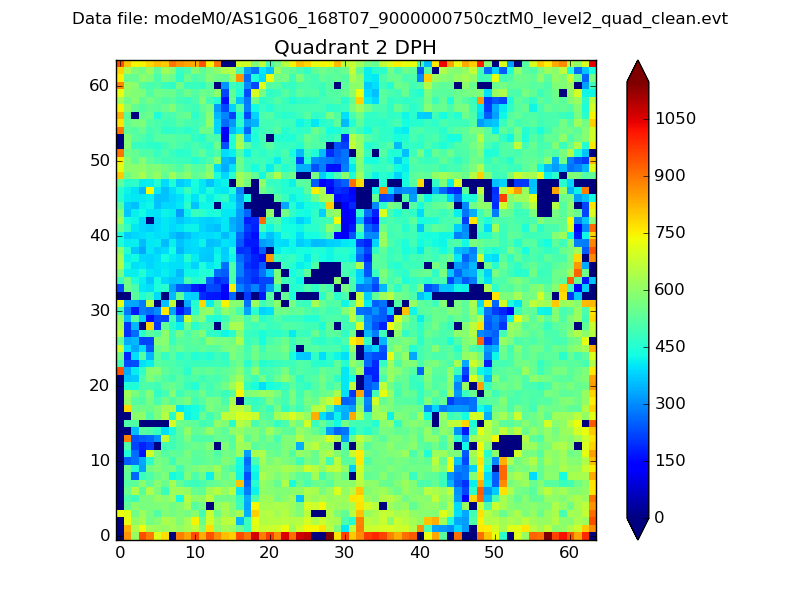
Histogram calculated using DETX and DETY for each event in the final _common_clean file
| Quadrant A |  |
 |
Quadrant B |
|---|---|---|---|
| Quadrant D | 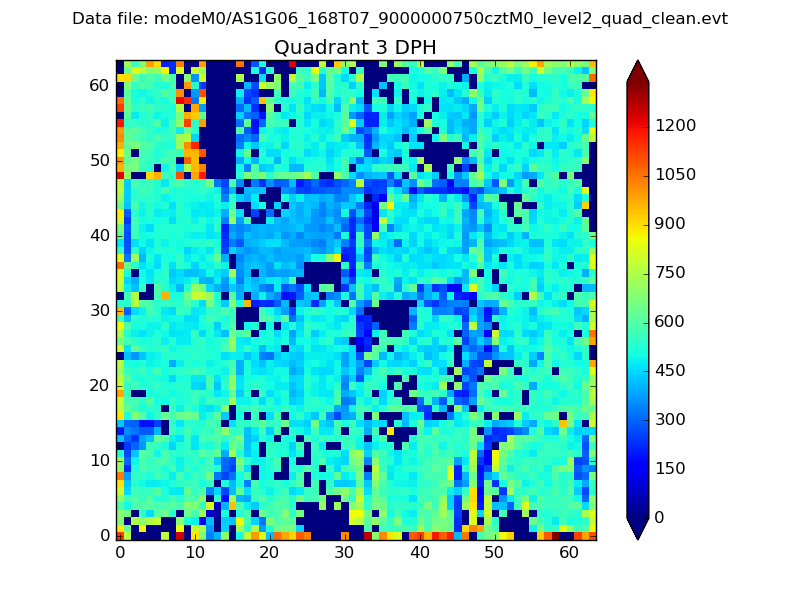 |
 |
Quadrant C |
| Plot type | Count rate plots | Images |
|---|---|---|
| Comparison with Poisson distribution Blue bars denote a histogram of data divided into 1 sec bins. Red curve is a Poisson curve with rate = median count rate of data. |
 |
 |
| Quadrant-wise count rates Data is divided into 100 sec bins |
 |
|
| Module-wise count rates for Quadrant A Data is divided into 100 sec bins |
 |
 |
| Module-wise count rates for Quadrant B Data is divided into 100 sec bins |
 |
 |
| Module-wise count rates for Quadrant C Data is divided into 100 sec bins |
 |
 |
| Module-wise count rates for Quadrant D Data is divided into 100 sec bins |
 |
 |
| Parameter | Plot |
|---|---|
| CZT HV Monitor |  |
| D_VDD |  |
| Temperature 1 |  |
| Veto HV Monitor |  |
| Veto LLD |  |
| Alpha Counter |  |
| _CPM_Rate |  |
| CZT Counter |  |
| +2.5 Volts monitor |  |
| +5 Volts monitor |  |
| _ROLL_ROT |  |
| _Roll_DEC |  |
| _Roll_RA |  |
| Veto Counter |  |