| Param | Original file | Final file |
|---|---|---|
| Filename | modeM0/AS1G06_052T01_9000000754cztM0_level2.evt | modeM0/AS1G06_052T01_9000000754cztM0_level2_quad_clean.evt |
| Size (bytes) | 4,660,868,160 | 1,092,954,240 |
| Size | 4.3 GB | 1.0 GB |
| Events in quadrant A | 35,391,070 | 7,075,388 |
| Events in quadrant B | 34,034,296 | 7,221,800 |
| Events in quadrant C | 31,792,654 | 7,116,903 |
| Events in quadrant D | 35,106,012 | 6,788,707 |
| Mode SS | |||
|---|---|---|---|
| Quadrant | BADHDUFLAG | Total packets | Discarded packets |
| A | 0 | 1460 | 0 |
| B | 0 | 1454 | 0 |
| C | 0 | 1454 | 0 |
| D | 0 | 1458 | 0 |
| Mode M0 | |||
|---|---|---|---|
| Quadrant | BADHDUFLAG | Total packets | Discarded packets |
| A | 0 | 157069 | 0 |
| B | 0 | 150684 | 0 |
| C | 0 | 147639 | 0 |
| D | 0 | 157176 | 0 |
| Mode M9 | |||
|---|---|---|---|
| Quadrant | BADHDUFLAG | Total packets | Discarded packets |
| A | 0 | 105 | 0 |
| B | 0 | 105 | 0 |
| C | 0 | 105 | 0 |
| D | 0 | 105 | 0 |
| Quadrant | Total seconds | Saturated seconds | Saturation percentage |
|---|---|---|---|
| A | 71514 | 1929 | 2.697374% |
| B | 71521 | 836 | 1.168887% |
| C | 71504 | 615 | 0.860092% |
| D | 71528 | 1070 | 1.495918% |
Noise dominated data is calculated using 1-second bins in cleaned event files. If a bin has >2000 counts, and if more than 50% of those come from <1% of pixels, then it is considered to be noise-dominated and hence unusable.
| Quadrant | # 1 sec bins | Bins with >0 counts | Bins with >2000 counts | High rate bins dominated by noise | Noise dominated (total time) | Noise dominated (detector-on time) | Marked lightcurve |
|---|---|---|---|---|---|---|---|
| A | 82218 | 71661 | 910 | 910 | 1.11% | 1.27% |  |
| B | 82218 | 71666 | 20 | 20 | 0.02% | 0.03% | 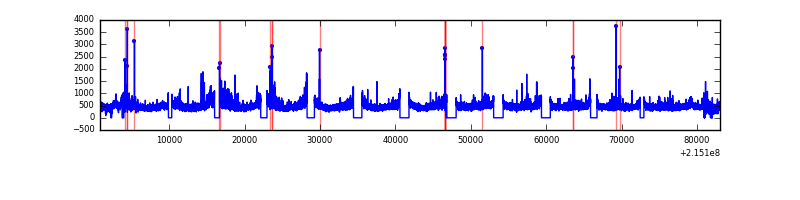 |
| C | 82218 | 71656 | 46 | 46 | 0.06% | 0.06% |  |
| D | 82218 | 71664 | 349 | 349 | 0.42% | 0.49% |  |
Top three noisy pixels from each quadrant. If the there are fewer than three noisy pixels in the level2.evt file, extra rows are filled as -1
| Pixel properties | Quadrant properties | ||||||
|---|---|---|---|---|---|---|---|
| Quadrant | DetID | PixID | Counts | Sigma | Mean | Median | Sigma |
| A | 15 | 236 | 3374299 | 2034.96 | 8184 | 8008 | 1654.2 |
| A | 15 | 223 | 179965 | 103.95 | 8184 | 8008 | 1654.2 |
| A | 15 | 234 | 106407 | 59.48 | 8184 | 8008 | 1654.2 |
| B | 15 | 204 | 1238380 | 794.03 | 8291 | 8085 | 1549.4 |
| B | 0 | 214 | 215982 | 134.18 | 8291 | 8085 | 1549.4 |
| B | 0 | 219 | 206161 | 127.84 | 8291 | 8085 | 1549.4 |
| C | 1 | 16 | 464960 | 250.66 | 7995 | 8034 | 1822.9 |
| C | 13 | 61 | 64688 | 31.08 | 7995 | 8034 | 1822.9 |
| C | 14 | 67 | 61623 | 29.4 | 7995 | 8034 | 1822.9 |
| D | 2 | 152 | 1919640 | 989.99 | 7996 | 7751 | 1931.2 |
| D | 11 | 241 | 795847 | 408.08 | 7996 | 7751 | 1931.2 |
| D | 2 | 63 | 685280 | 350.83 | 7996 | 7751 | 1931.2 |
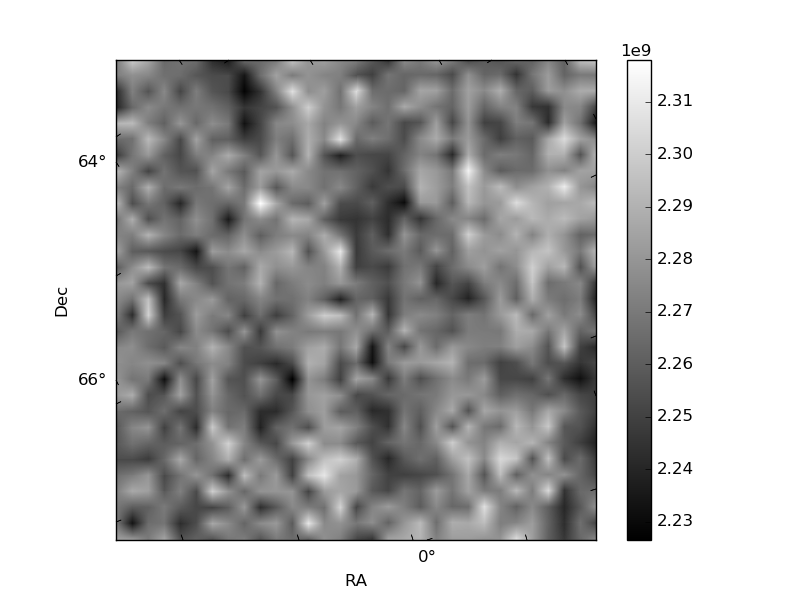
Histogram calculated using DETX and DETY for each event in the final _common_clean file
| Quadrant A | 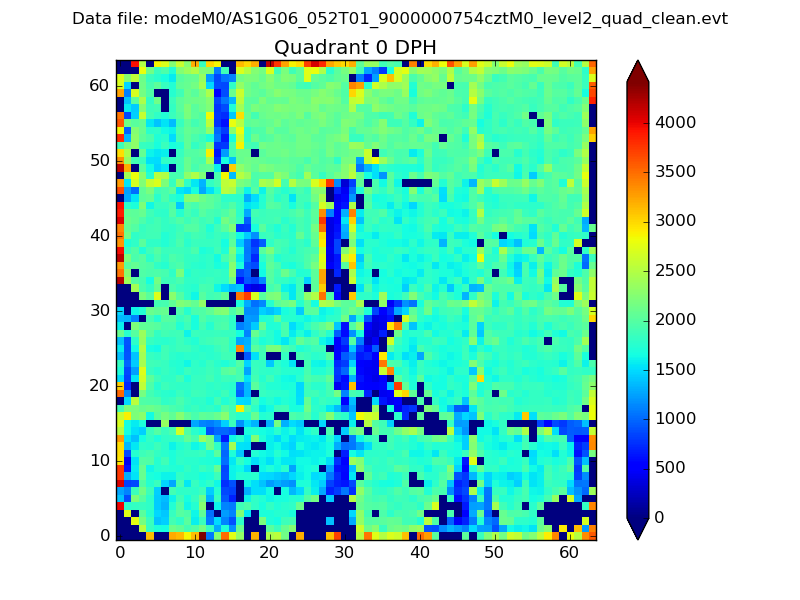 |
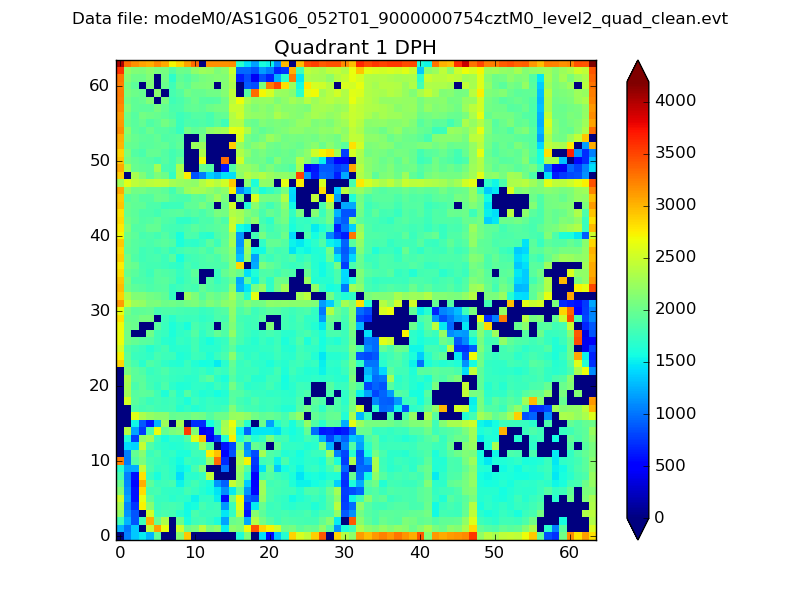 |
Quadrant B |
|---|---|---|---|
| Quadrant D | 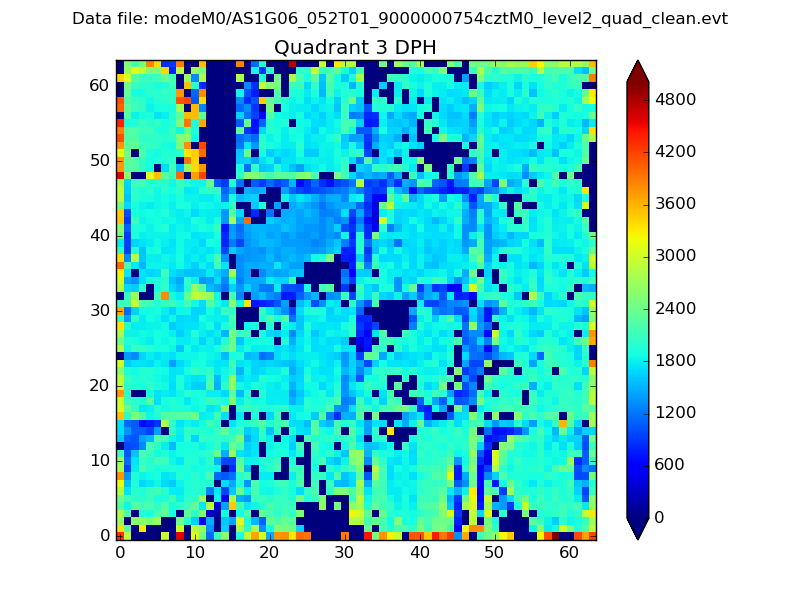 |
 |
Quadrant C |
| Plot type | Count rate plots | Images |
|---|---|---|
| Comparison with Poisson distribution Blue bars denote a histogram of data divided into 1 sec bins. Red curve is a Poisson curve with rate = median count rate of data. |
 |
 |
| Quadrant-wise count rates Data is divided into 100 sec bins |
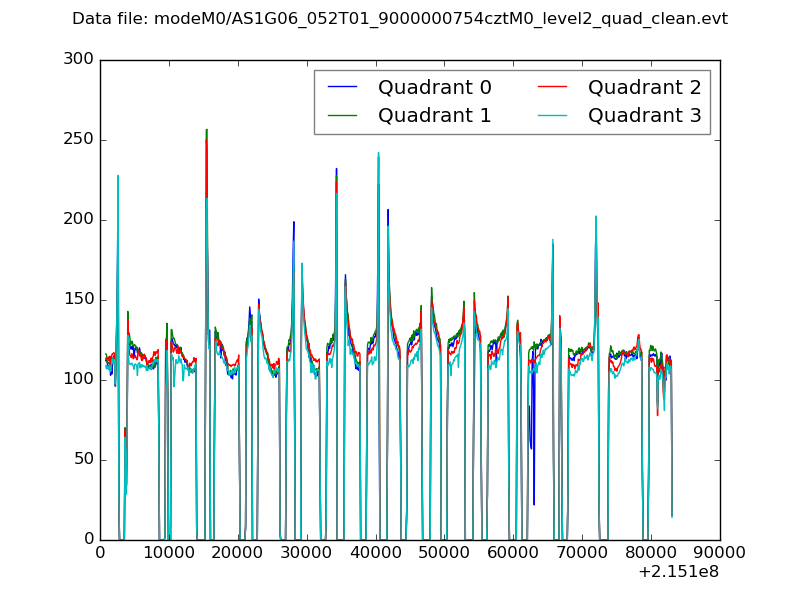 |
|
| Module-wise count rates for Quadrant A Data is divided into 100 sec bins |
 |
 |
| Module-wise count rates for Quadrant B Data is divided into 100 sec bins |
 |
 |
| Module-wise count rates for Quadrant C Data is divided into 100 sec bins |
 |
 |
| Module-wise count rates for Quadrant D Data is divided into 100 sec bins |
 |
 |
| Parameter | Plot |
|---|---|
| CZT HV Monitor |  |
| D_VDD | 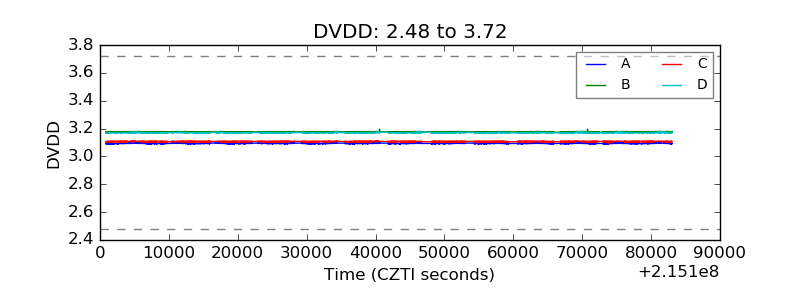 |
| Temperature 1 | 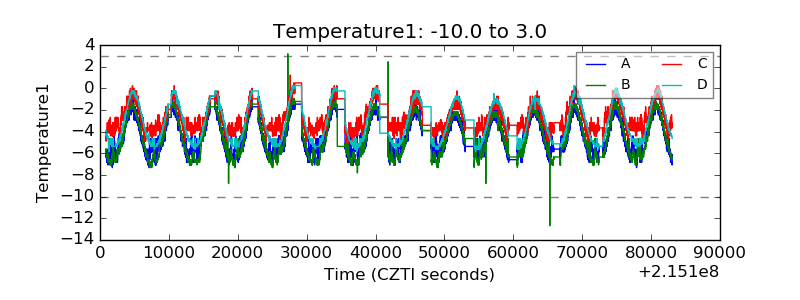 |
| Veto HV Monitor |  |
| Veto LLD |  |
| Alpha Counter |  |
| _CPM_Rate |  |
| CZT Counter | 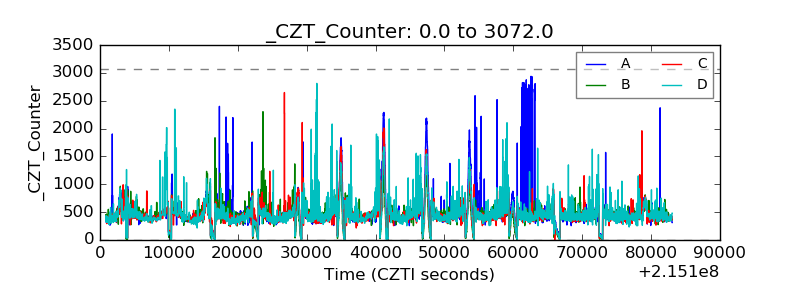 |
| +2.5 Volts monitor |  |
| +5 Volts monitor |  |
| _ROLL_ROT | 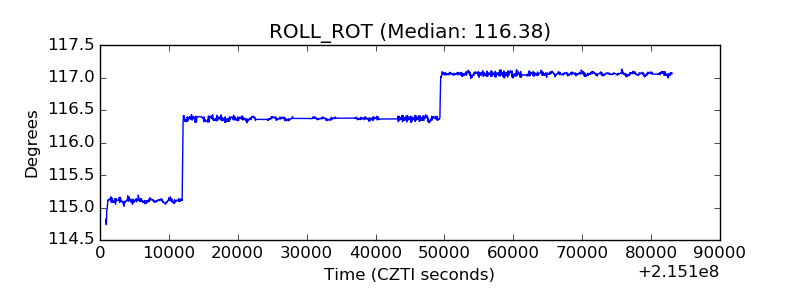 |
| _Roll_DEC |  |
| _Roll_RA |  |
| Veto Counter |  |