| Param | Original file | Final file |
|---|---|---|
| Filename | modeM0/AS1A02_197T02_9000000752cztM0_level2.evt | modeM0/AS1A02_197T02_9000000752cztM0_level2_quad_clean.evt |
| Size (bytes) | 950,031,360 | 200,718,720 |
| Size | 906.0 MB | 191.4 MB |
| Events in quadrant A | 6,869,749 | 1,270,409 |
| Events in quadrant B | 7,113,680 | 1,299,394 |
| Events in quadrant C | 6,708,726 | 1,268,330 |
| Events in quadrant D | 7,067,034 | 1,210,341 |
| Mode M0 | |||
|---|---|---|---|
| Quadrant | BADHDUFLAG | Total packets | Discarded packets |
| A | 0 | 31129 | 0 |
| B | 0 | 31250 | 0 |
| C | 0 | 30811 | 0 |
| D | 0 | 32070 | 0 |
| Mode M9 | |||
|---|---|---|---|
| Quadrant | BADHDUFLAG | Total packets | Discarded packets |
| A | 0 | 5 | 0 |
| B | 0 | 5 | 0 |
| C | 0 | 5 | 0 |
| D | 0 | 5 | 0 |
| Mode SS | |||
|---|---|---|---|
| Quadrant | BADHDUFLAG | Total packets | Discarded packets |
| A | 0 | 302 | 0 |
| B | 0 | 300 | 0 |
| C | 0 | 300 | 0 |
| D | 0 | 300 | 0 |
| Quadrant | Total seconds | Saturated seconds | Saturation percentage |
|---|---|---|---|
| A | 14957 | 426 | 2.848165% |
| B | 14943 | 412 | 2.757144% |
| C | 14938 | 284 | 1.901192% |
| D | 14944 | 328 | 2.194861% |
Noise dominated data is calculated using 1-second bins in cleaned event files. If a bin has >2000 counts, and if more than 50% of those come from <1% of pixels, then it is considered to be noise-dominated and hence unusable.
| Quadrant | # 1 sec bins | Bins with >0 counts | Bins with >2000 counts | High rate bins dominated by noise | Noise dominated (total time) | Noise dominated (detector-on time) | Marked lightcurve |
|---|---|---|---|---|---|---|---|
| A | 15147 | 15048 | 2 | 2 | 0.01% | 0.01% | 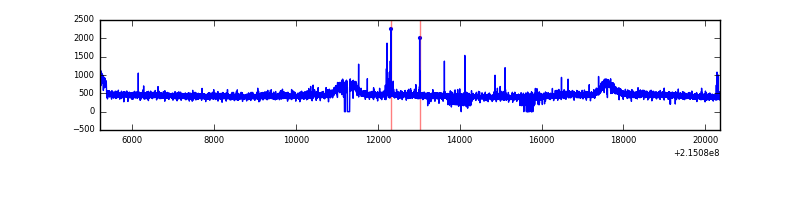 |
| B | 15147 | 15047 | 5 | 5 | 0.03% | 0.03% |  |
| C | 15147 | 15051 | 0 | 0 | 0.00% | 0.00% |  |
| D | 15147 | 15046 | 34 | 34 | 0.22% | 0.23% | 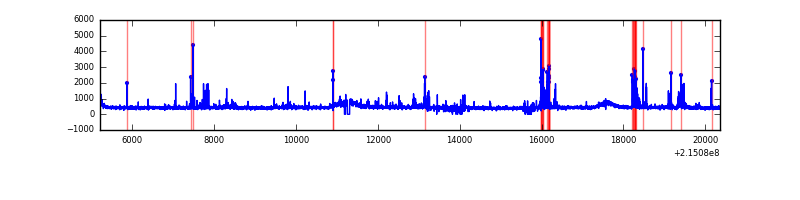 |
Top three noisy pixels from each quadrant. If the there are fewer than three noisy pixels in the level2.evt file, extra rows are filled as -1
| Pixel properties | Quadrant properties | ||||||
|---|---|---|---|---|---|---|---|
| Quadrant | DetID | PixID | Counts | Sigma | Mean | Median | Sigma |
| A | 15 | 236 | 44966 | 121.32 | 1749 | 1705 | 356.6 |
| A | 4 | 2 | 39743 | 106.67 | 1749 | 1705 | 356.6 |
| A | 15 | 223 | 30252 | 80.06 | 1749 | 1705 | 356.6 |
| B | 15 | 204 | 231528 | 683.11 | 1768 | 1719 | 336.4 |
| B | 4 | 81 | 36592 | 103.66 | 1768 | 1719 | 336.4 |
| B | 12 | 111 | 32940 | 92.81 | 1768 | 1719 | 336.4 |
| C | 14 | 67 | 15166 | 34.24 | 1708 | 1711 | 393.0 |
| C | 9 | 16 | 14056 | 31.41 | 1708 | 1711 | 393.0 |
| C | 13 | 61 | 13957 | 31.16 | 1708 | 1711 | 393.0 |
| D | 12 | 233 | 215138 | 515.16 | 1703 | 1647 | 414.4 |
| D | 1 | 239 | 141900 | 338.44 | 1703 | 1647 | 414.4 |
| D | 13 | 172 | 117988 | 280.74 | 1703 | 1647 | 414.4 |
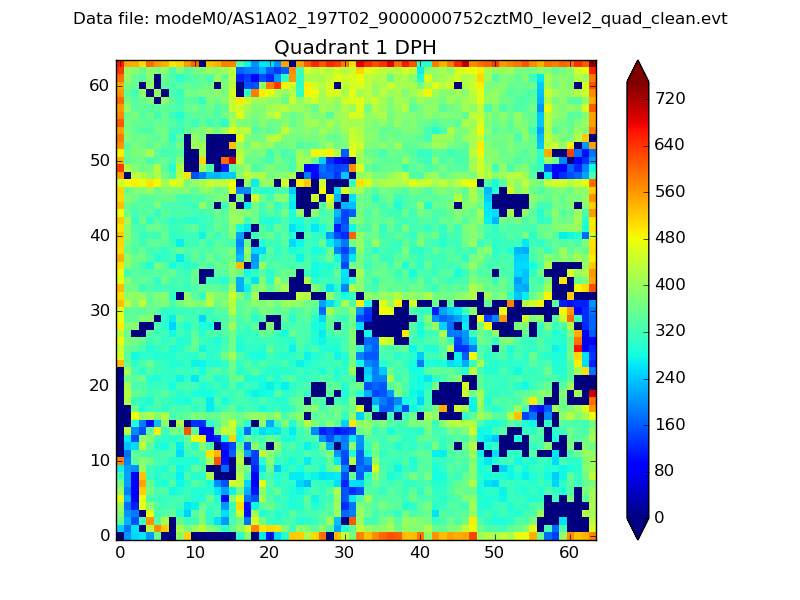
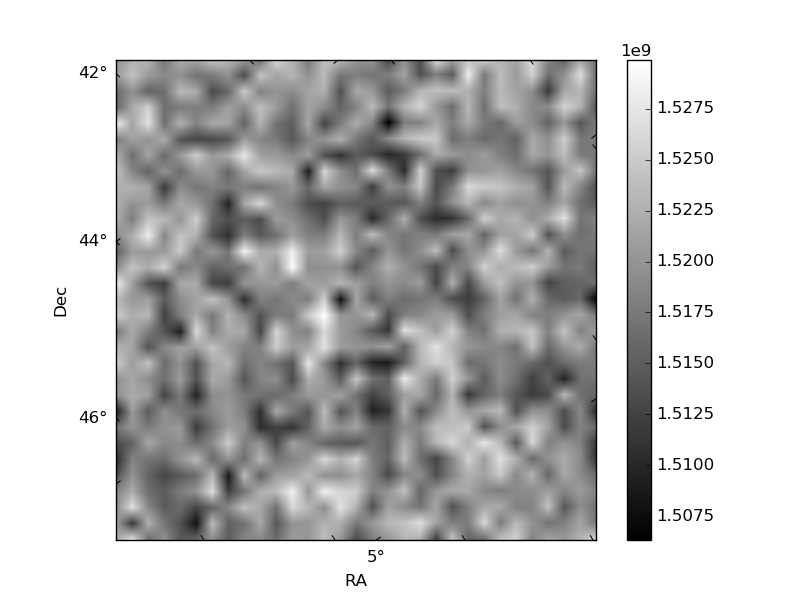
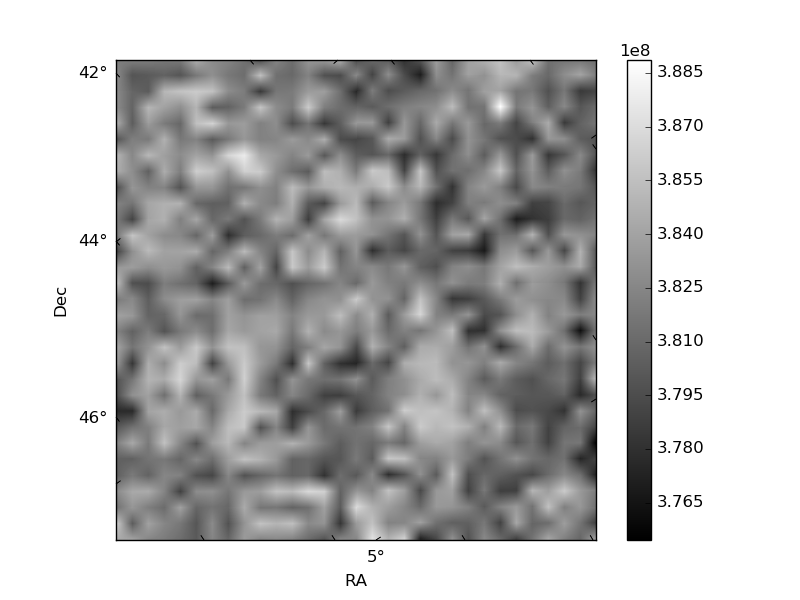
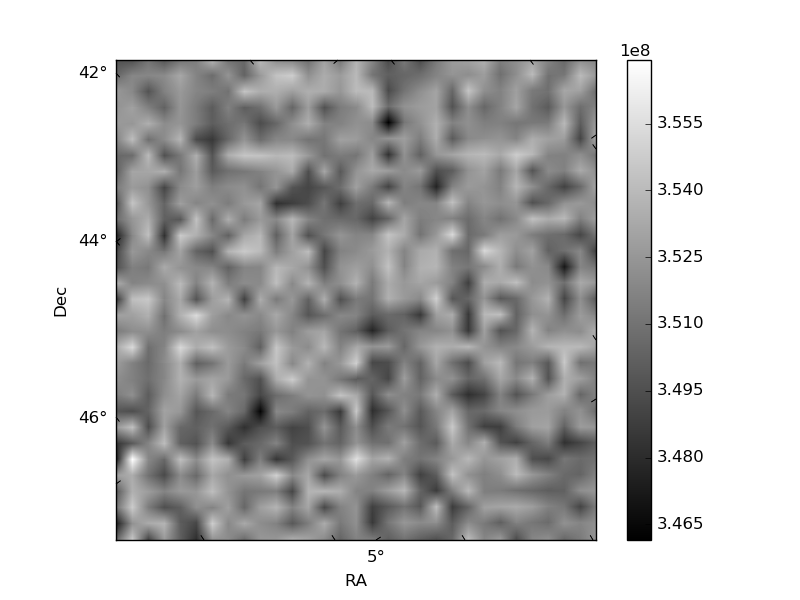
Histogram calculated using DETX and DETY for each event in the final _common_clean file
| Quadrant A |  |
 |
Quadrant B |
|---|---|---|---|
| Quadrant D | 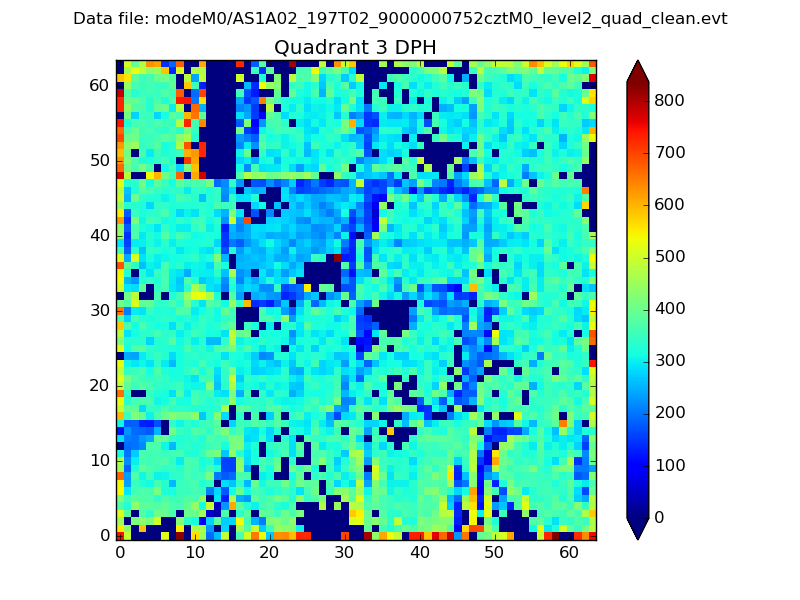 |
 |
Quadrant C |
| Plot type | Count rate plots | Images |
|---|---|---|
| Comparison with Poisson distribution Blue bars denote a histogram of data divided into 1 sec bins. Red curve is a Poisson curve with rate = median count rate of data. |
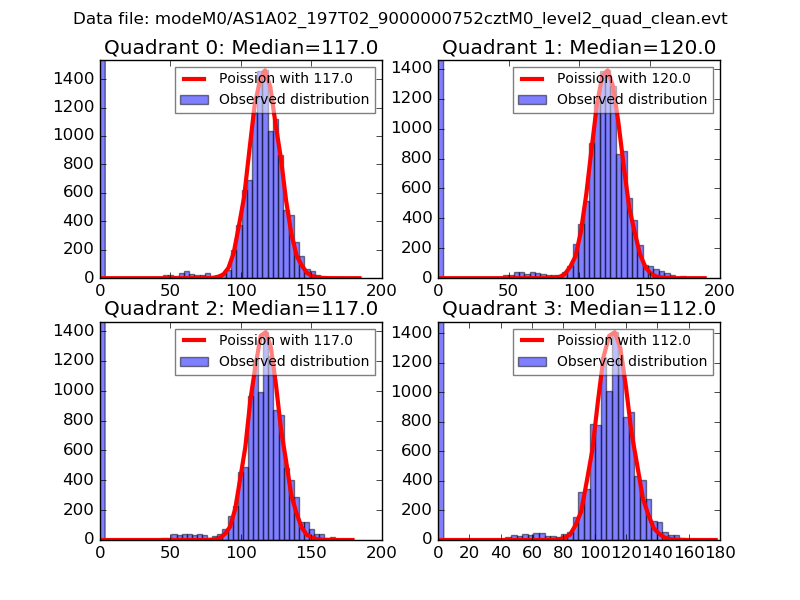 |
 |
| Quadrant-wise count rates Data is divided into 100 sec bins |
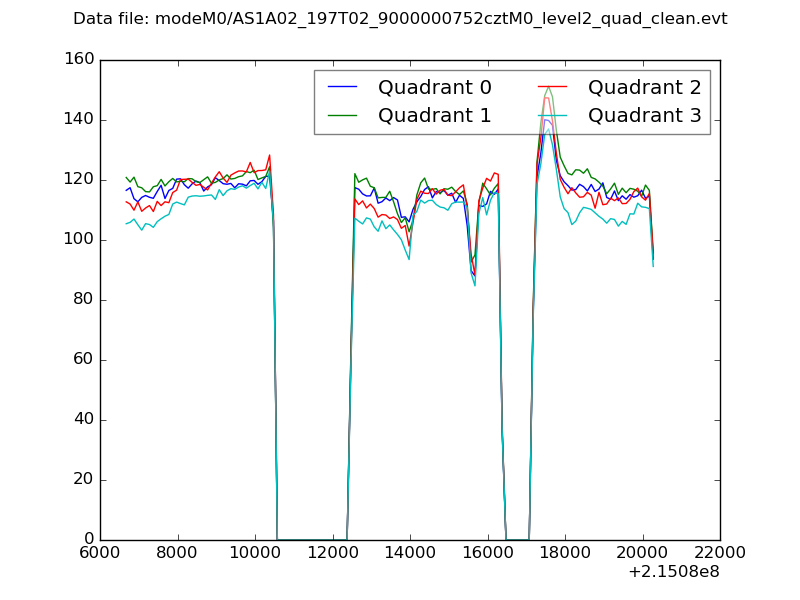 |
|
| Module-wise count rates for Quadrant A Data is divided into 100 sec bins |
 |
 |
| Module-wise count rates for Quadrant B Data is divided into 100 sec bins |
 |
 |
| Module-wise count rates for Quadrant C Data is divided into 100 sec bins |
 |
 |
| Module-wise count rates for Quadrant D Data is divided into 100 sec bins |
 |
 |
| Parameter | Plot |
|---|---|
| CZT HV Monitor |  |
| D_VDD | 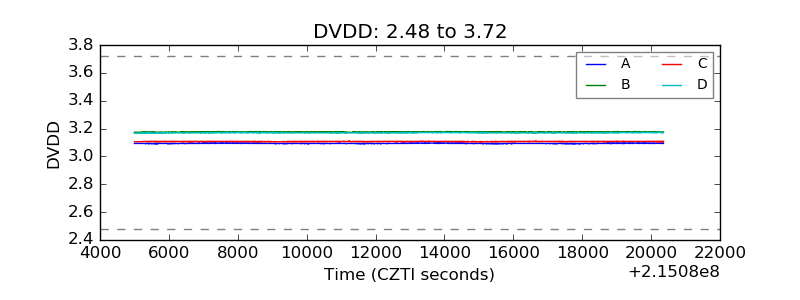 |
| Temperature 1 |  |
| Veto HV Monitor | 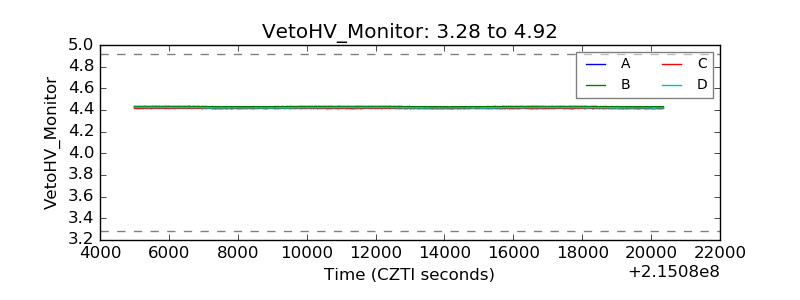 |
| Veto LLD | 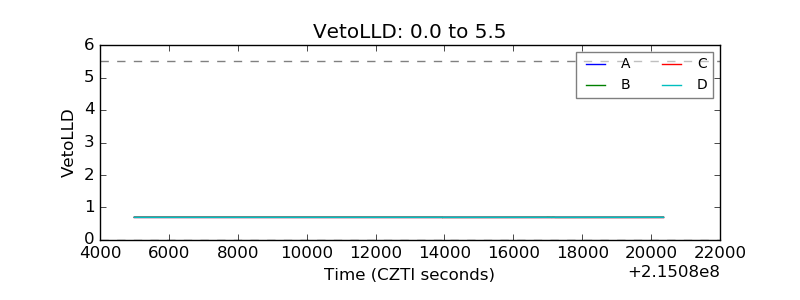 |
| Alpha Counter |  |
| _CPM_Rate |  |
| CZT Counter |  |
| +2.5 Volts monitor |  |
| +5 Volts monitor |  |
| _ROLL_ROT |  |
| _Roll_DEC |  |
| _Roll_RA |  |
| Veto Counter |  |