| Param | Original file | Final file |
|---|---|---|
| Filename | modeM0/AS1A02_197T01_9000000748cztM0_level2.evt | modeM0/AS1A02_197T01_9000000748cztM0_level2_quad_clean.evt |
| Size (bytes) | 1,003,466,880 | 166,878,720 |
| Size | 957.0 MB | 159.1 MB |
| Events in quadrant A | 8,910,068 | 992,293 |
| Events in quadrant B | 6,845,308 | 1,028,104 |
| Events in quadrant C | 6,681,838 | 1,012,430 |
| Events in quadrant D | 6,919,197 | 967,547 |
| Mode SS | |||
|---|---|---|---|
| Quadrant | BADHDUFLAG | Total packets | Discarded packets |
| A | 0 | 312 | 0 |
| B | 0 | 312 | 0 |
| C | 0 | 312 | 0 |
| D | 0 | 312 | 0 |
| Mode M9 | |||
|---|---|---|---|
| Quadrant | BADHDUFLAG | Total packets | Discarded packets |
| A | 0 | 27 | 0 |
| B | 0 | 27 | 0 |
| C | 0 | 27 | 0 |
| D | 0 | 27 | 0 |
| Mode M0 | |||
|---|---|---|---|
| Quadrant | BADHDUFLAG | Total packets | Discarded packets |
| A | 0 | 37303 | 0 |
| B | 0 | 31207 | 0 |
| C | 0 | 31221 | 0 |
| D | 0 | 32166 | 0 |
| Quadrant | Total seconds | Saturated seconds | Saturation percentage |
|---|---|---|---|
| A | 15268 | 116 | 0.759759% |
| B | 15265 | 63 | 0.412709% |
| C | 15266 | 71 | 0.465086% |
| D | 15270 | 69 | 0.451866% |
Noise dominated data is calculated using 1-second bins in cleaned event files. If a bin has >2000 counts, and if more than 50% of those come from <1% of pixels, then it is considered to be noise-dominated and hence unusable.
| Quadrant | # 1 sec bins | Bins with >0 counts | Bins with >2000 counts | High rate bins dominated by noise | Noise dominated (total time) | Noise dominated (detector-on time) | Marked lightcurve |
|---|---|---|---|---|---|---|---|
| A | 18031 | 15274 | 16 | 16 | 0.09% | 0.10% |  |
| B | 18031 | 15274 | 1 | 1 | 0.01% | 0.01% |  |
| C | 18031 | 15274 | 18 | 18 | 0.10% | 0.12% |  |
| D | 18031 | 15274 | 25 | 25 | 0.14% | 0.16% |  |
Top three noisy pixels from each quadrant. If the there are fewer than three noisy pixels in the level2.evt file, extra rows are filled as -1
| Pixel properties | Quadrant properties | ||||||
|---|---|---|---|---|---|---|---|
| Quadrant | DetID | PixID | Counts | Sigma | Mean | Median | Sigma |
| A | 15 | 236 | 1859747 | 5320.89 | 1714 | 1674 | 349.2 |
| A | 15 | 79 | 405528 | 1156.5 | 1714 | 1674 | 349.2 |
| A | 15 | 223 | 39113 | 107.21 | 1714 | 1674 | 349.2 |
| B | 12 | 111 | 32331 | 92.43 | 1745 | 1700 | 331.4 |
| B | 11 | 111 | 25039 | 70.42 | 1745 | 1700 | 331.4 |
| B | 15 | 204 | 23451 | 65.63 | 1745 | 1700 | 331.4 |
| C | 9 | 16 | 110835 | 281.27 | 1679 | 1688 | 388.0 |
| C | 13 | 61 | 13418 | 30.23 | 1679 | 1688 | 388.0 |
| C | 8 | 222 | 9264 | 19.52 | 1679 | 1688 | 388.0 |
| D | 8 | 230 | 208742 | 513.55 | 1669 | 1618 | 403.3 |
| D | 4 | 95 | 84986 | 206.7 | 1669 | 1618 | 403.3 |
| D | 12 | 233 | 82304 | 200.05 | 1669 | 1618 | 403.3 |
Histogram calculated using DETX and DETY for each event in the final _common_clean file
| Quadrant A |  |
 |
Quadrant B |
|---|---|---|---|
| Quadrant D |  |
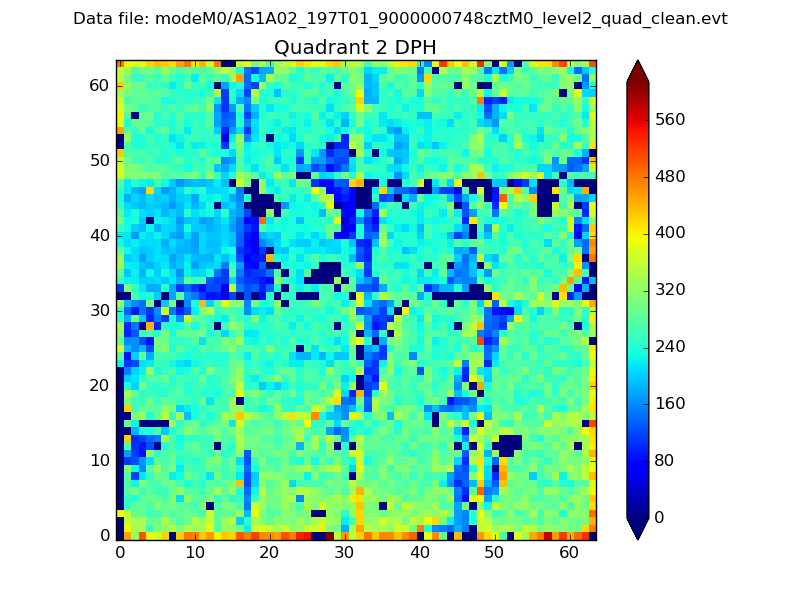 |
Quadrant C |
| Plot type | Count rate plots | Images |
|---|---|---|
| Comparison with Poisson distribution Blue bars denote a histogram of data divided into 1 sec bins. Red curve is a Poisson curve with rate = median count rate of data. |
 |
 |
| Quadrant-wise count rates Data is divided into 100 sec bins |
 |
|
| Module-wise count rates for Quadrant A Data is divided into 100 sec bins |
 |
 |
| Module-wise count rates for Quadrant B Data is divided into 100 sec bins |
 |
 |
| Module-wise count rates for Quadrant C Data is divided into 100 sec bins |
 |
 |
| Module-wise count rates for Quadrant D Data is divided into 100 sec bins |
 |
 |
| Parameter | Plot |
|---|---|
| CZT HV Monitor |  |
| D_VDD |  |
| Temperature 1 |  |
| Veto HV Monitor |  |
| Veto LLD |  |
| Alpha Counter | 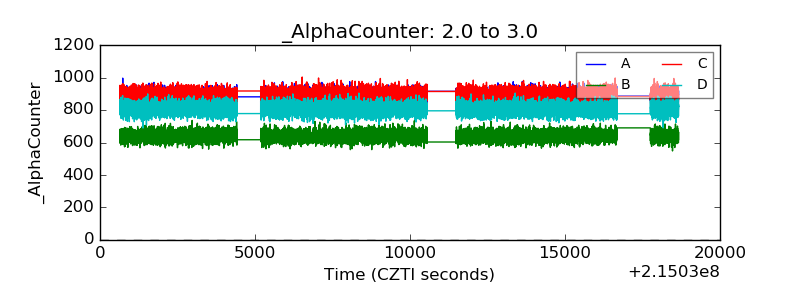 |
| _CPM_Rate | 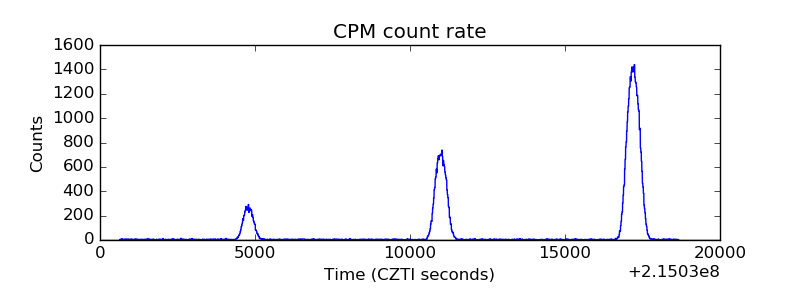 |
| CZT Counter |  |
| +2.5 Volts monitor |  |
| +5 Volts monitor |  |
| _ROLL_ROT |  |
| _Roll_DEC |  |
| _Roll_RA |  |
| Veto Counter |  |