| Param | Original file | Final file |
|---|---|---|
| Filename | modeM0/AS1G06_089T01_9000000746cztM0_level2.evt | modeM0/AS1G06_089T01_9000000746cztM0_level2_quad_clean.evt |
| Size (bytes) | 4,197,916,800 | 763,637,760 |
| Size | 3.9 GB | 728.3 MB |
| Events in quadrant A | 32,795,242 | 4,801,786 |
| Events in quadrant B | 29,115,191 | 4,942,535 |
| Events in quadrant C | 27,115,062 | 4,819,178 |
| Events in quadrant D | 34,118,514 | 4,509,344 |
| Mode SS | |||
|---|---|---|---|
| Quadrant | BADHDUFLAG | Total packets | Discarded packets |
| A | 0 | 1206 | 0 |
| B | 0 | 1206 | 0 |
| C | 0 | 1206 | 0 |
| D | 0 | 1206 | 0 |
| Mode M9 | |||
|---|---|---|---|
| Quadrant | BADHDUFLAG | Total packets | Discarded packets |
| A | 0 | 84 | 0 |
| B | 0 | 84 | 0 |
| C | 0 | 84 | 0 |
| D | 0 | 84 | 0 |
| Mode M0 | |||
|---|---|---|---|
| Quadrant | BADHDUFLAG | Total packets | Discarded packets |
| A | 0 | 137603 | 0 |
| B | 0 | 124770 | 0 |
| C | 0 | 122140 | 0 |
| D | 0 | 143467 | 0 |
| Quadrant | Total seconds | Saturated seconds | Saturation percentage |
|---|---|---|---|
| A | 59136 | 1708 | 2.888258% |
| B | 59140 | 1050 | 1.775448% |
| C | 59139 | 561 | 0.948613% |
| D | 59128 | 2236 | 3.781626% |
Noise dominated data is calculated using 1-second bins in cleaned event files. If a bin has >2000 counts, and if more than 50% of those come from <1% of pixels, then it is considered to be noise-dominated and hence unusable.
| Quadrant | # 1 sec bins | Bins with >0 counts | Bins with >2000 counts | High rate bins dominated by noise | Noise dominated (total time) | Noise dominated (detector-on time) | Marked lightcurve |
|---|---|---|---|---|---|---|---|
| A | 67638 | 59166 | 383 | 383 | 0.57% | 0.65% |  |
| B | 67638 | 59166 | 34 | 34 | 0.05% | 0.06% |  |
| C | 67638 | 59165 | 4 | 4 | 0.01% | 0.01% |  |
| D | 67638 | 59165 | 1365 | 1365 | 2.02% | 2.31% |  |
Top three noisy pixels from each quadrant. If the there are fewer than three noisy pixels in the level2.evt file, extra rows are filled as -1
| Pixel properties | Quadrant properties | ||||||
|---|---|---|---|---|---|---|---|
| Quadrant | DetID | PixID | Counts | Sigma | Mean | Median | Sigma |
| A | 15 | 236 | 2798462 | 1937.83 | 7089 | 6938 | 1440.5 |
| A | 15 | 79 | 1540011 | 1064.23 | 7089 | 6938 | 1440.5 |
| A | 0 | 31 | 812932 | 559.51 | 7089 | 6938 | 1440.5 |
| B | 4 | 81 | 384273 | 276.57 | 7180 | 7015 | 1364.0 |
| B | 15 | 204 | 328853 | 235.94 | 7180 | 7015 | 1364.0 |
| B | 0 | 219 | 238550 | 169.74 | 7180 | 7015 | 1364.0 |
| C | 1 | 16 | 139590 | 83.37 | 6890 | 6910 | 1591.4 |
| C | 13 | 61 | 55319 | 30.42 | 6890 | 6910 | 1591.4 |
| C | 8 | 222 | 29610 | 14.26 | 6890 | 6910 | 1591.4 |
| D | 8 | 230 | 4336316 | 2594.79 | 6832 | 6620 | 1668.6 |
| D | 7 | 203 | 1813992 | 1083.16 | 6832 | 6620 | 1668.6 |
| D | 8 | 195 | 482617 | 285.27 | 6832 | 6620 | 1668.6 |
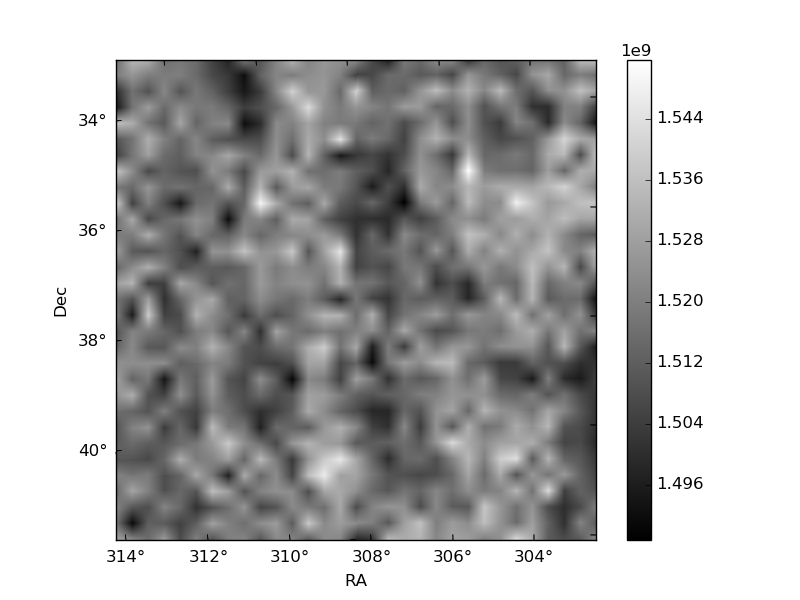
Histogram calculated using DETX and DETY for each event in the final _common_clean file
| Quadrant A | 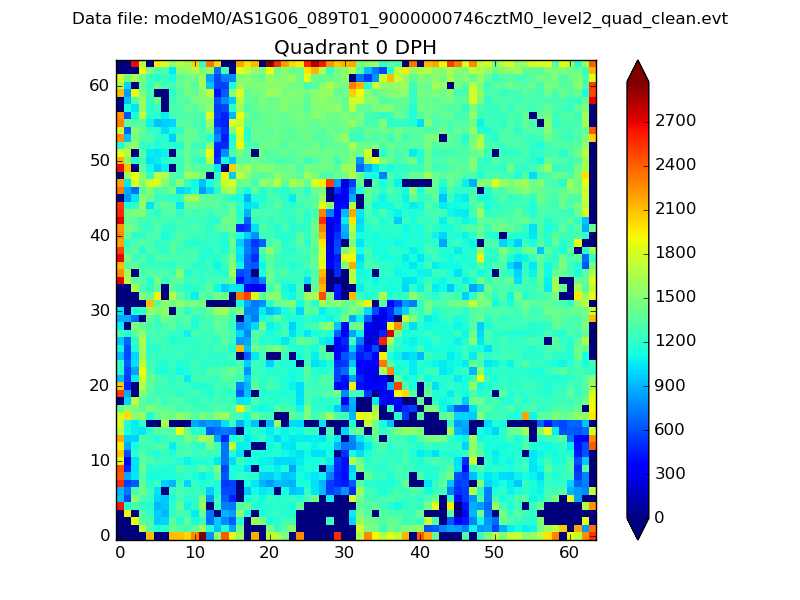 |
 |
Quadrant B |
|---|---|---|---|
| Quadrant D |  |
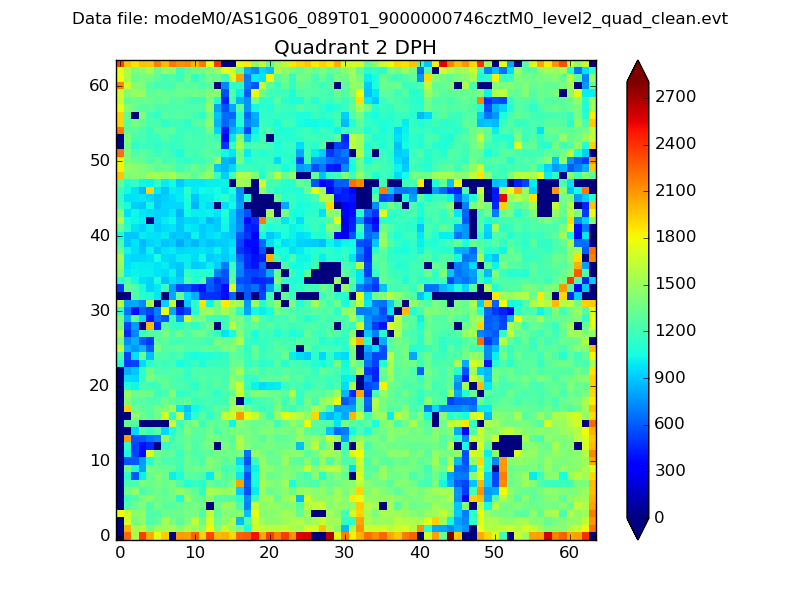 |
Quadrant C |
| Plot type | Count rate plots | Images |
|---|---|---|
| Comparison with Poisson distribution Blue bars denote a histogram of data divided into 1 sec bins. Red curve is a Poisson curve with rate = median count rate of data. |
 |
 |
| Quadrant-wise count rates Data is divided into 100 sec bins |
 |
|
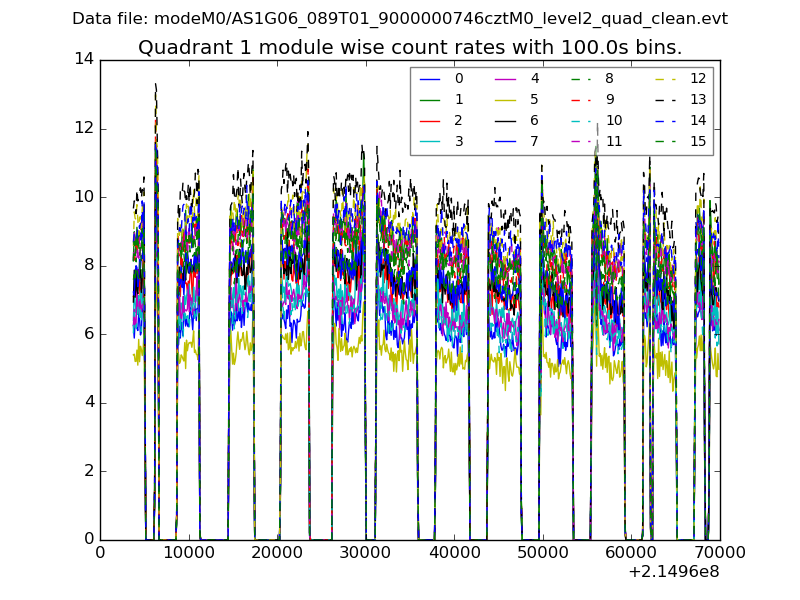
| Module-wise count rates for Quadrant A Data is divided into 100 sec bins |
 |
 |
| Module-wise count rates for Quadrant B Data is divided into 100 sec bins |
 |
 |
| Module-wise count rates for Quadrant C Data is divided into 100 sec bins |
 |
 |
| Module-wise count rates for Quadrant D Data is divided into 100 sec bins |
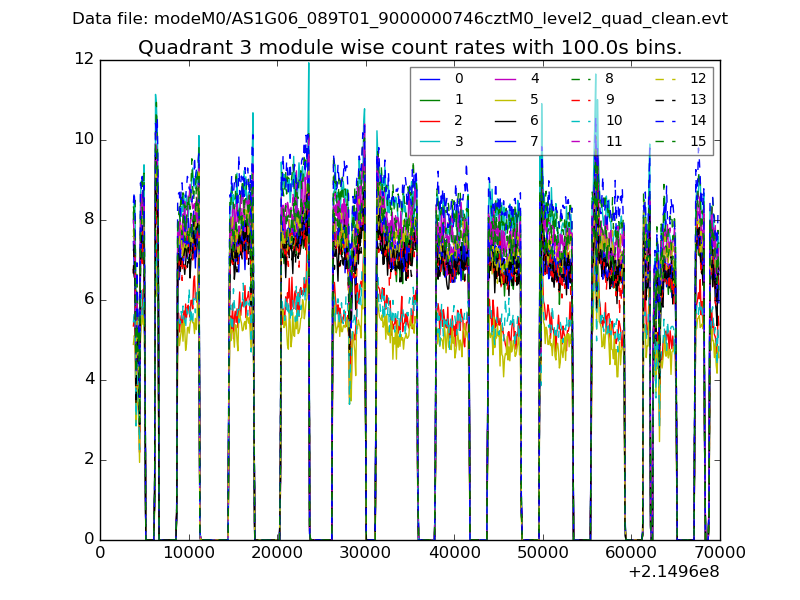 |
 |
| Parameter | Plot |
|---|---|
| CZT HV Monitor | 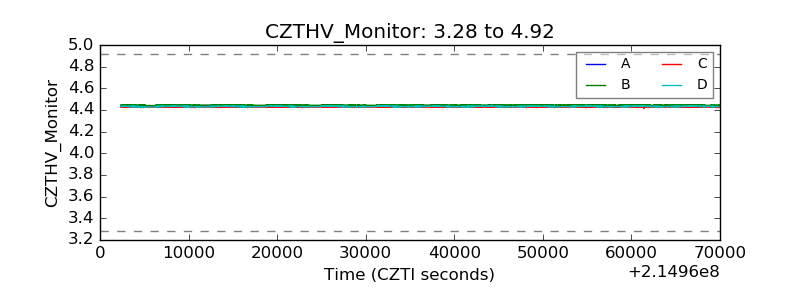 |
| D_VDD | 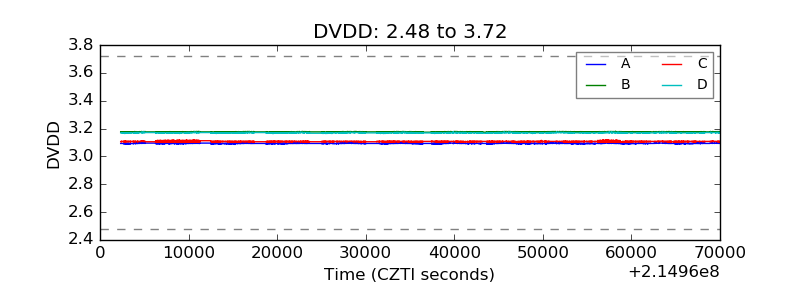 |
| Temperature 1 |  |
| Veto HV Monitor |  |
| Veto LLD |  |
| Alpha Counter |  |
| _CPM_Rate |  |
| CZT Counter |  |
| +2.5 Volts monitor |  |
| +5 Volts monitor |  |
| _ROLL_ROT |  |
| _Roll_DEC |  |
| _Roll_RA |  |
| Veto Counter |  |