| Param | Original file | Final file |
|---|---|---|
| Filename | modeM0/AS1A02_106T01_9000000744cztM0_level2.evt | modeM0/AS1A02_106T01_9000000744cztM0_level2_quad_clean.evt |
| Size (bytes) | 6,603,580,800 | 1,241,447,040 |
| Size | 6.2 GB | 1.2 GB |
| Events in quadrant A | 46,882,146 | 7,656,876 |
| Events in quadrant B | 49,394,861 | 7,896,320 |
| Events in quadrant C | 45,967,611 | 7,707,922 |
| Events in quadrant D | 50,818,784 | 7,312,335 |
| Mode SS | |||
|---|---|---|---|
| Quadrant | BADHDUFLAG | Total packets | Discarded packets |
| A | 0 | 2086 | 0 |
| B | 0 | 2086 | 0 |
| C | 0 | 2084 | 0 |
| D | 0 | 2086 | 0 |
| Mode M9 | |||
|---|---|---|---|
| Quadrant | BADHDUFLAG | Total packets | Discarded packets |
| A | 0 | 140 | 0 |
| B | 0 | 140 | 0 |
| C | 0 | 140 | 0 |
| D | 0 | 140 | 0 |
| Mode M0 | |||
|---|---|---|---|
| Quadrant | BADHDUFLAG | Total packets | Discarded packets |
| A | 0 | 211316 | 0 |
| B | 0 | 215099 | 0 |
| C | 0 | 209905 | 0 |
| D | 0 | 224984 | 0 |
| Quadrant | Total seconds | Saturated seconds | Saturation percentage |
|---|---|---|---|
| A | 102541 | 1335 | 1.301918% |
| B | 102559 | 1388 | 1.353367% |
| C | 102562 | 881 | 0.858993% |
| D | 102580 | 1950 | 1.900955% |
Noise dominated data is calculated using 1-second bins in cleaned event files. If a bin has >2000 counts, and if more than 50% of those come from <1% of pixels, then it is considered to be noise-dominated and hence unusable.
| Quadrant | # 1 sec bins | Bins with >0 counts | Bins with >2000 counts | High rate bins dominated by noise | Noise dominated (total time) | Noise dominated (detector-on time) | Marked lightcurve |
|---|---|---|---|---|---|---|---|
| A | 116845 | 102822 | 36 | 36 | 0.03% | 0.04% |  |
| B | 116845 | 102835 | 70 | 70 | 0.06% | 0.07% |  |
| C | 116845 | 102827 | 0 | 0 | 0.00% | 0.00% |  |
| D | 116845 | 102838 | 893 | 893 | 0.76% | 0.87% |  |
Top three noisy pixels from each quadrant. If the there are fewer than three noisy pixels in the level2.evt file, extra rows are filled as -1
| Pixel properties | Quadrant properties | ||||||
|---|---|---|---|---|---|---|---|
| Quadrant | DetID | PixID | Counts | Sigma | Mean | Median | Sigma |
| A | 15 | 79 | 305172 | 120.08 | 12015 | 11749 | 2443.5 |
| A | 15 | 236 | 211371 | 81.69 | 12015 | 11749 | 2443.5 |
| A | 0 | 226 | 116655 | 42.93 | 12015 | 11749 | 2443.5 |
| B | 15 | 204 | 853407 | 365.36 | 12179 | 11885 | 2303.2 |
| B | 4 | 81 | 785453 | 335.86 | 12179 | 11885 | 2303.2 |
| B | 12 | 111 | 224547 | 92.33 | 12179 | 11885 | 2303.2 |
| C | 13 | 61 | 93738 | 30.52 | 11721 | 11774 | 2685.8 |
| C | 8 | 128 | 83308 | 26.63 | 11721 | 11774 | 2685.8 |
| C | 1 | 16 | 77621 | 24.52 | 11721 | 11774 | 2685.8 |
| D | 7 | 203 | 2011945 | 705.13 | 11630 | 11281 | 2837.3 |
| D | 12 | 233 | 1732959 | 606.8 | 11630 | 11281 | 2837.3 |
| D | 8 | 195 | 1225900 | 428.09 | 11630 | 11281 | 2837.3 |
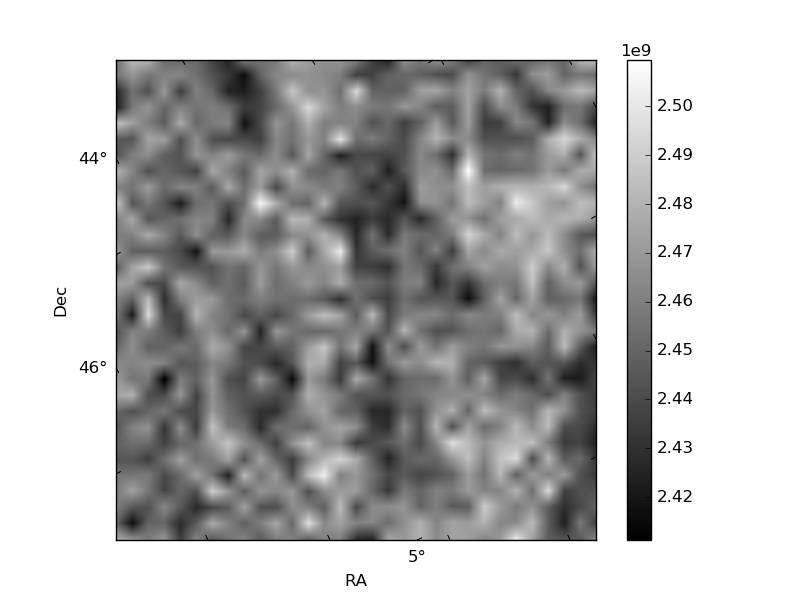
Histogram calculated using DETX and DETY for each event in the final _common_clean file
| Quadrant A |  |
 |
Quadrant B |
|---|---|---|---|
| Quadrant D |  |
 |
Quadrant C |
| Plot type | Count rate plots | Images |
|---|---|---|
| Comparison with Poisson distribution Blue bars denote a histogram of data divided into 1 sec bins. Red curve is a Poisson curve with rate = median count rate of data. |
 |
 |
| Quadrant-wise count rates Data is divided into 100 sec bins |
 |
|
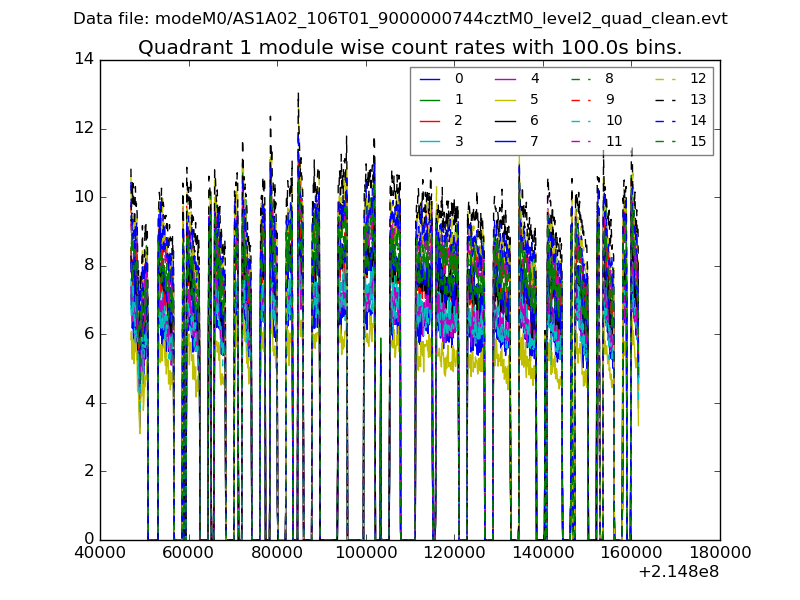
| Module-wise count rates for Quadrant A Data is divided into 100 sec bins |
 |
 |
| Module-wise count rates for Quadrant B Data is divided into 100 sec bins |
 |
 |
| Module-wise count rates for Quadrant C Data is divided into 100 sec bins |
 |
 |
| Module-wise count rates for Quadrant D Data is divided into 100 sec bins |
 |
 |
| Parameter | Plot |
|---|---|
| CZT HV Monitor | 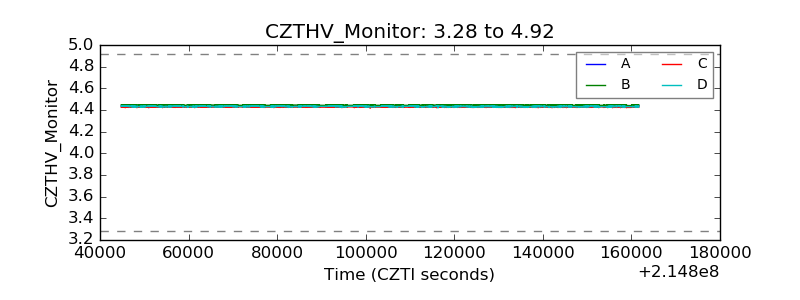 |
| D_VDD |  |
| Temperature 1 |  |
| Veto HV Monitor |  |
| Veto LLD |  |
| Alpha Counter |  |
| _CPM_Rate |  |
| CZT Counter |  |
| +2.5 Volts monitor |  |
| +5 Volts monitor |  |
| _ROLL_ROT |  |
| _Roll_DEC |  |
| _Roll_RA |  |
| Veto Counter |  |