| Param | Original file | Final file |
|---|---|---|
| Filename | modeM0/AS1A02_149T01_9000000740cztM0_level2.evt | modeM0/AS1A02_149T01_9000000740cztM0_level2_quad_clean.evt |
| Size (bytes) | 9,796,896,000 | 1,712,871,360 |
| Size | 9.1 GB | 1.6 GB |
| Events in quadrant A | 69,189,994 | 10,495,154 |
| Events in quadrant B | 74,468,021 | 10,646,603 |
| Events in quadrant C | 67,214,479 | 10,668,908 |
| Events in quadrant D | 75,984,647 | 10,077,741 |
| Mode M0 | |||
|---|---|---|---|
| Quadrant | BADHDUFLAG | Total packets | Discarded packets |
| A | 0 | 304891 | 0 |
| B | 0 | 314378 | 0 |
| C | 0 | 300767 | 0 |
| D | 0 | 324863 | 0 |
| Mode SS | |||
|---|---|---|---|
| Quadrant | BADHDUFLAG | Total packets | Discarded packets |
| A | 0 | 2966 | 0 |
| B | 0 | 2968 | 0 |
| C | 0 | 2960 | 0 |
| D | 0 | 2962 | 0 |
| Mode M9 | |||
|---|---|---|---|
| Quadrant | BADHDUFLAG | Total packets | Discarded packets |
| A | 0 | 214 | 0 |
| B | 0 | 214 | 0 |
| C | 0 | 214 | 0 |
| D | 0 | 214 | 0 |
| Quadrant | Total seconds | Saturated seconds | Saturation percentage |
|---|---|---|---|
| A | 145874 | 2736 | 1.875591% |
| B | 145832 | 2608 | 1.788359% |
| C | 145883 | 1267 | 0.868504% |
| D | 145852 | 2763 | 1.894386% |
Noise dominated data is calculated using 1-second bins in cleaned event files. If a bin has >2000 counts, and if more than 50% of those come from <1% of pixels, then it is considered to be noise-dominated and hence unusable.
| Quadrant | # 1 sec bins | Bins with >0 counts | Bins with >2000 counts | High rate bins dominated by noise | Noise dominated (total time) | Noise dominated (detector-on time) | Marked lightcurve |
|---|---|---|---|---|---|---|---|
| A | 167592 | 146250 | 460 | 460 | 0.27% | 0.31% |  |
| B | 167592 | 146241 | 148 | 148 | 0.09% | 0.10% |  |
| C | 167592 | 146246 | 6 | 6 | 0.00% | 0.00% |  |
| D | 167592 | 146238 | 1063 | 1063 | 0.63% | 0.73% |  |
Top three noisy pixels from each quadrant. If the there are fewer than three noisy pixels in the level2.evt file, extra rows are filled as -1
| Pixel properties | Quadrant properties | ||||||
|---|---|---|---|---|---|---|---|
| Quadrant | DetID | PixID | Counts | Sigma | Mean | Median | Sigma |
| A | 15 | 236 | 1228568 | 335.97 | 17582 | 17181 | 3605.6 |
| A | 0 | 50 | 261875 | 67.86 | 17582 | 17181 | 3605.6 |
| A | 12 | 194 | 171383 | 42.77 | 17582 | 17181 | 3605.6 |
| B | 15 | 204 | 2065680 | 610.08 | 17737 | 17316 | 3357.5 |
| B | 11 | 51 | 707656 | 205.61 | 17737 | 17316 | 3357.5 |
| B | 4 | 81 | 592433 | 171.29 | 17737 | 17316 | 3357.5 |
| C | 9 | 16 | 234347 | 54.9 | 17101 | 17180 | 3955.7 |
| C | 14 | 67 | 138836 | 30.75 | 17101 | 17180 | 3955.7 |
| C | 13 | 61 | 137182 | 30.34 | 17101 | 17180 | 3955.7 |
| D | 4 | 95 | 3530588 | 844.92 | 17039 | 16541 | 4159.0 |
| D | 8 | 195 | 1187440 | 281.53 | 17039 | 16541 | 4159.0 |
| D | 1 | 20 | 1018481 | 240.91 | 17039 | 16541 | 4159.0 |
Histogram calculated using DETX and DETY for each event in the final _common_clean file
| Quadrant A | 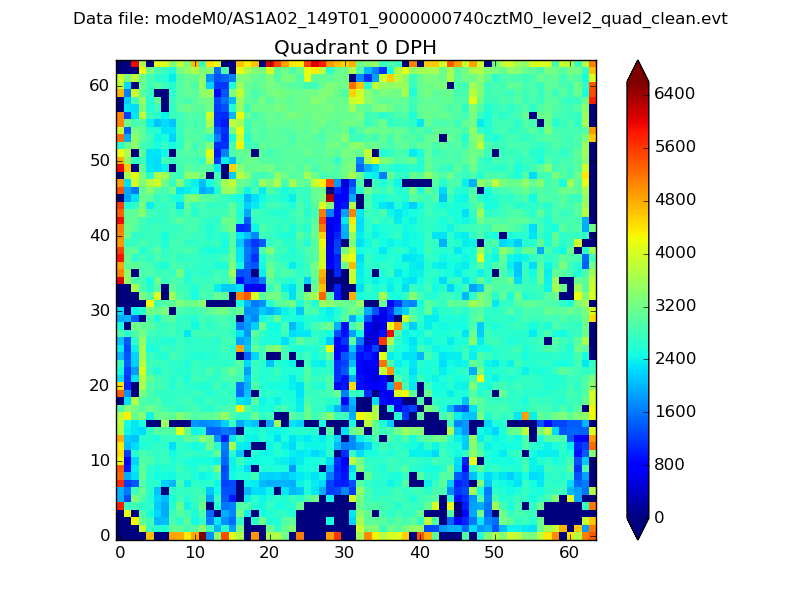 |
 |
Quadrant B |
|---|---|---|---|
| Quadrant D |  |
 |
Quadrant C |
| Plot type | Count rate plots | Images |
|---|---|---|
| Comparison with Poisson distribution Blue bars denote a histogram of data divided into 1 sec bins. Red curve is a Poisson curve with rate = median count rate of data. |
 |
 |
| Quadrant-wise count rates Data is divided into 100 sec bins |
 |
|
| Module-wise count rates for Quadrant A Data is divided into 100 sec bins |
 |
 |
| Module-wise count rates for Quadrant B Data is divided into 100 sec bins |
 |
 |
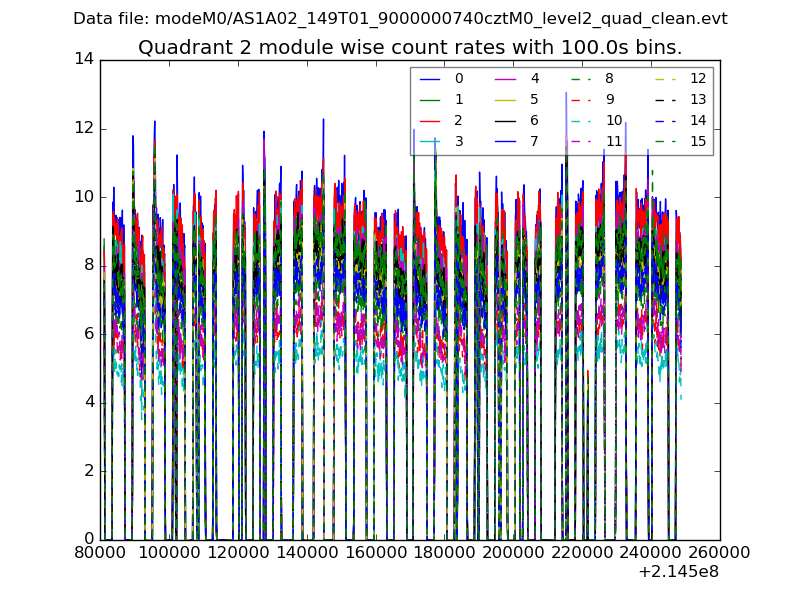
| Module-wise count rates for Quadrant C Data is divided into 100 sec bins |
 |
 |
| Module-wise count rates for Quadrant D Data is divided into 100 sec bins |
 |
 |
| Parameter | Plot |
|---|---|
| CZT HV Monitor |  |
| D_VDD |  |
| Temperature 1 |  |
| Veto HV Monitor |  |
| Veto LLD |  |
| Alpha Counter |  |
| _CPM_Rate |  |
| CZT Counter |  |
| +2.5 Volts monitor |  |
| +5 Volts monitor |  |
| _ROLL_ROT | 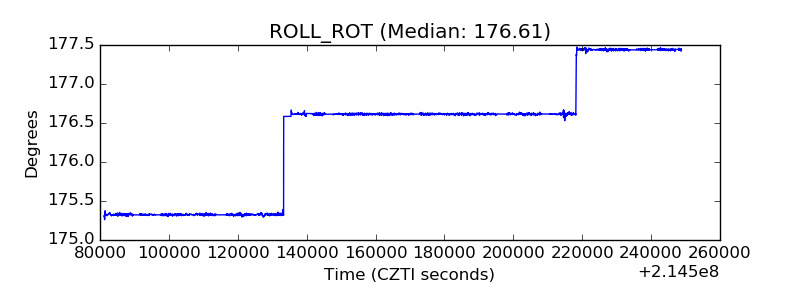 |
| _Roll_DEC | 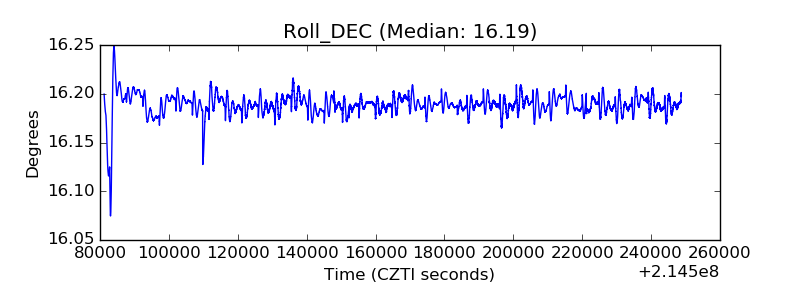 |
| _Roll_RA | 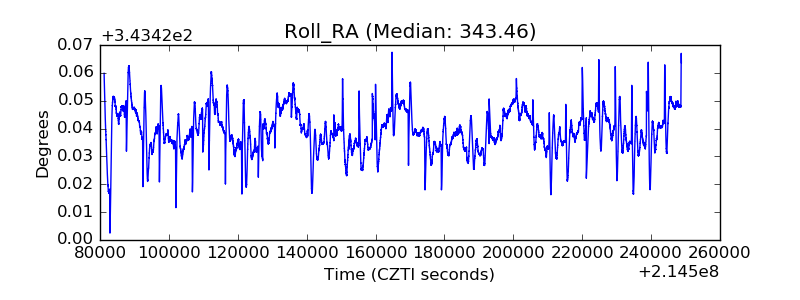 |
| Veto Counter | 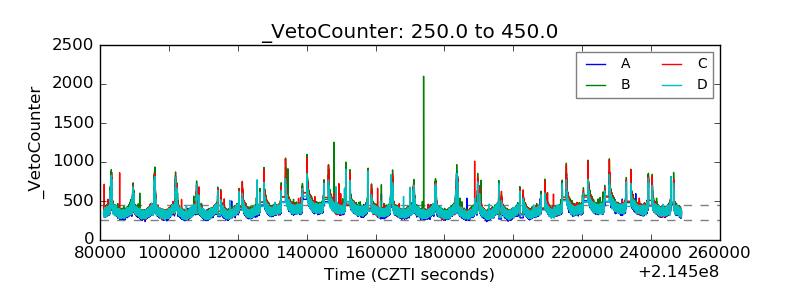 |