| Param | Original file | Final file |
|---|---|---|
| Filename | modeM0/AS1A02_150T01_9000000738cztM0_level2.evt | modeM0/AS1A02_150T01_9000000738cztM0_level2_quad_clean.evt |
| Size (bytes) | 3,636,961,920 | 678,369,600 |
| Size | 3.4 GB | 646.9 MB |
| Events in quadrant A | 24,873,886 | 4,226,238 |
| Events in quadrant B | 28,212,509 | 4,301,040 |
| Events in quadrant C | 24,539,722 | 4,274,354 |
| Events in quadrant D | 28,903,327 | 4,070,049 |
| Mode M0 | |||
|---|---|---|---|
| Quadrant | BADHDUFLAG | Total packets | Discarded packets |
| A | 0 | 109814 | 0 |
| B | 0 | 118007 | 0 |
| C | 0 | 109672 | 0 |
| D | 0 | 121502 | 0 |
| Mode SS | |||
|---|---|---|---|
| Quadrant | BADHDUFLAG | Total packets | Discarded packets |
| A | 0 | 1090 | 0 |
| B | 0 | 1090 | 0 |
| C | 0 | 1090 | 0 |
| D | 0 | 1090 | 0 |
| Mode M9 | |||
|---|---|---|---|
| Quadrant | BADHDUFLAG | Total packets | Discarded packets |
| A | 0 | 103 | 0 |
| B | 0 | 103 | 0 |
| C | 0 | 103 | 0 |
| D | 0 | 103 | 0 |
| Quadrant | Total seconds | Saturated seconds | Saturation percentage |
|---|---|---|---|
| A | 53572 | 447 | 0.834391% |
| B | 53593 | 593 | 1.106488% |
| C | 53571 | 386 | 0.720539% |
| D | 53559 | 1083 | 2.022069% |
Noise dominated data is calculated using 1-second bins in cleaned event files. If a bin has >2000 counts, and if more than 50% of those come from <1% of pixels, then it is considered to be noise-dominated and hence unusable.
| Quadrant | # 1 sec bins | Bins with >0 counts | Bins with >2000 counts | High rate bins dominated by noise | Noise dominated (total time) | Noise dominated (detector-on time) | Marked lightcurve |
|---|---|---|---|---|---|---|---|
| A | 63937 | 53670 | 2 | 2 | 0.00% | 0.00% |  |
| B | 63937 | 53668 | 31 | 31 | 0.05% | 0.06% | 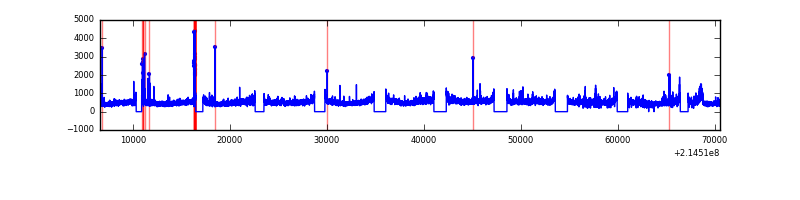 |
| C | 63937 | 53669 | 0 | 0 | 0.00% | 0.00% |  |
| D | 63937 | 53666 | 573 | 573 | 0.90% | 1.07% |  |
Top three noisy pixels from each quadrant. If the there are fewer than three noisy pixels in the level2.evt file, extra rows are filled as -1
| Pixel properties | Quadrant properties | ||||||
|---|---|---|---|---|---|---|---|
| Quadrant | DetID | PixID | Counts | Sigma | Mean | Median | Sigma |
| A | 13 | 14 | 78926 | 56.1 | 6425 | 6291 | 1294.7 |
| A | 15 | 174 | 68147 | 47.78 | 6425 | 6291 | 1294.7 |
| A | 12 | 194 | 62298 | 43.26 | 6425 | 6291 | 1294.7 |
| B | 5 | 172 | 1827173 | 1473.64 | 6508 | 6366 | 1235.6 |
| B | 15 | 204 | 544365 | 435.42 | 6508 | 6366 | 1235.6 |
| B | 11 | 51 | 304426 | 241.23 | 6508 | 6366 | 1235.6 |
| C | 13 | 61 | 49825 | 30.17 | 6269 | 6308 | 1442.5 |
| C | 14 | 67 | 34647 | 19.64 | 6269 | 6308 | 1442.5 |
| C | 8 | 222 | 25497 | 13.3 | 6269 | 6308 | 1442.5 |
| D | 4 | 95 | 1513093 | 993.66 | 6241 | 6065 | 1516.6 |
| D | 1 | 20 | 1386133 | 909.95 | 6241 | 6065 | 1516.6 |
| D | 2 | 152 | 1057783 | 693.45 | 6241 | 6065 | 1516.6 |
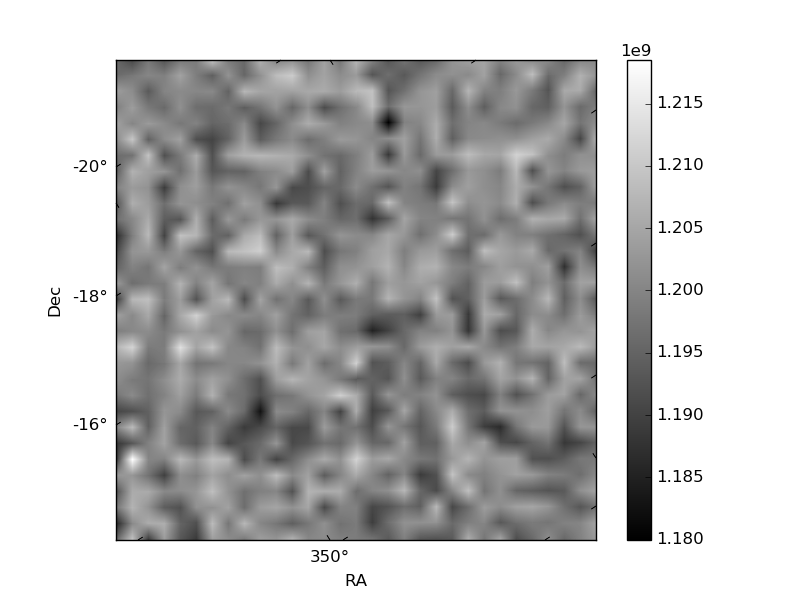
Histogram calculated using DETX and DETY for each event in the final _common_clean file
| Quadrant A |  |
 |
Quadrant B |
|---|---|---|---|
| Quadrant D |  |
 |
Quadrant C |
| Plot type | Count rate plots | Images |
|---|---|---|
| Comparison with Poisson distribution Blue bars denote a histogram of data divided into 1 sec bins. Red curve is a Poisson curve with rate = median count rate of data. |
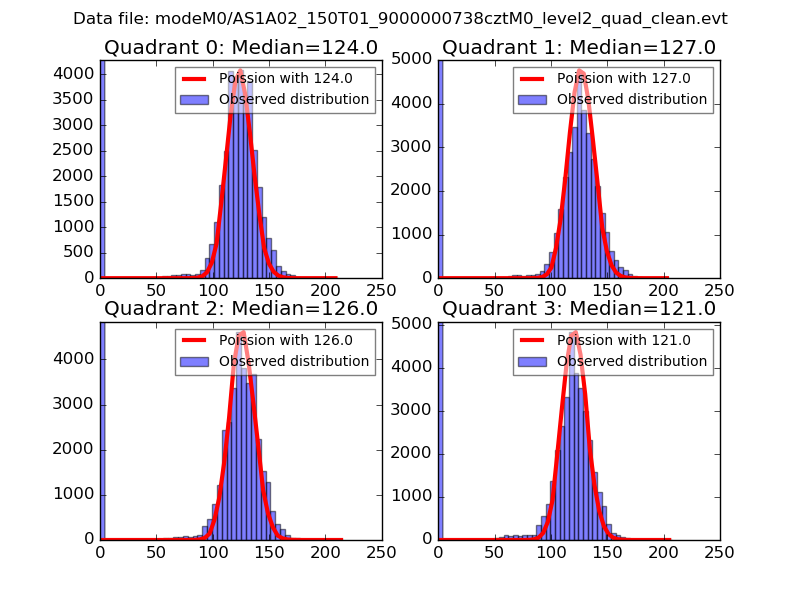 |
 |
| Quadrant-wise count rates Data is divided into 100 sec bins |
 |
|
| Module-wise count rates for Quadrant A Data is divided into 100 sec bins |
 |
 |
| Module-wise count rates for Quadrant B Data is divided into 100 sec bins |
 |
 |
| Module-wise count rates for Quadrant C Data is divided into 100 sec bins |
 |
 |
| Module-wise count rates for Quadrant D Data is divided into 100 sec bins |
 |
 |
| Parameter | Plot |
|---|---|
| CZT HV Monitor |  |
| D_VDD |  |
| Temperature 1 |  |
| Veto HV Monitor |  |
| Veto LLD |  |
| Alpha Counter |  |
| _CPM_Rate |  |
| CZT Counter |  |
| +2.5 Volts monitor | 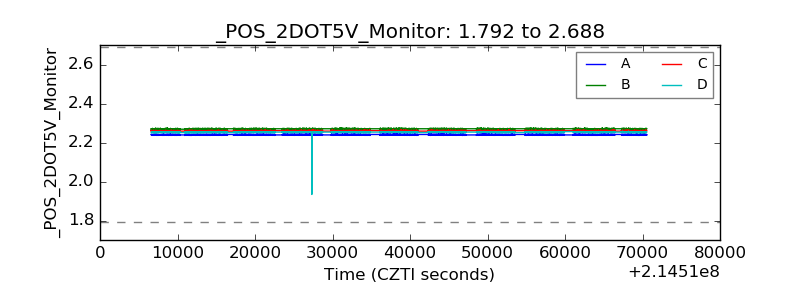 |
| +5 Volts monitor | 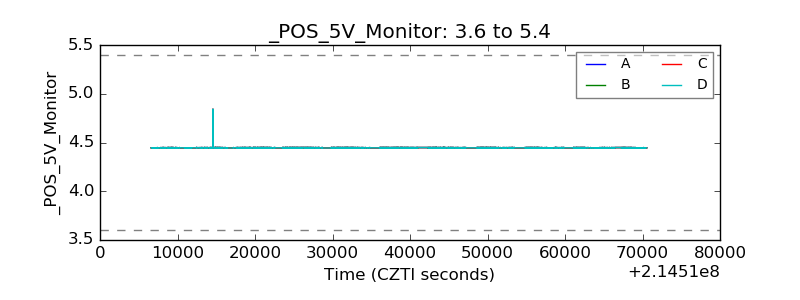 |
| _ROLL_ROT |  |
| _Roll_DEC |  |
| _Roll_RA | 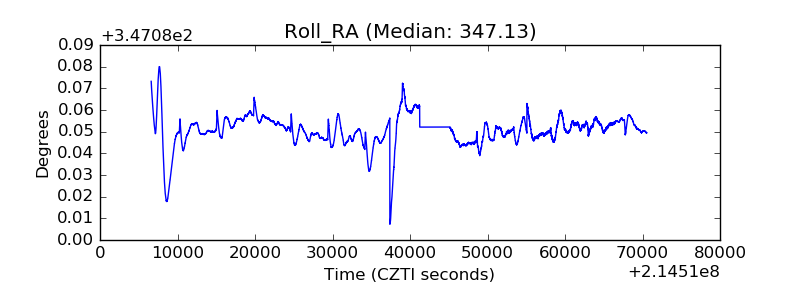 |
| Veto Counter | 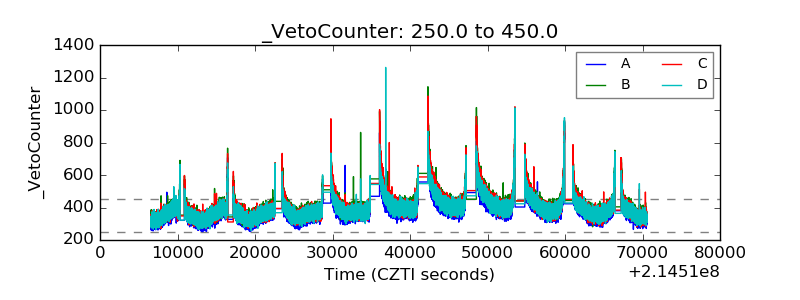 |