| Param | Original file | Final file |
|---|---|---|
| Filename | modeM0/AS1A02_098T01_9000000736cztM0_level2_bc.evt | modeM0/AS1A02_098T01_9000000736cztM0_level2_quad_clean.evt |
| Size (bytes) | 4,624,585,920 | 1,650,741,120 |
| Size | 4.3 GB | 1.5 GB |
| Events in quadrant A | 26,895,819 | 10,329,721 |
| Events in quadrant B | 39,297,276 | 10,275,664 |
| Events in quadrant C | 27,608,844 | 10,378,048 |
| Events in quadrant D | 37,172,959 | 9,880,393 |
| Mode M9 | |||
|---|---|---|---|
| Quadrant | BADHDUFLAG | Total packets | Discarded packets |
| A | 0 | 196 | 0 |
| B | 0 | 196 | 0 |
| C | 0 | 196 | 0 |
| D | 0 | 196 | 0 |
| Mode SS | |||
|---|---|---|---|
| Quadrant | BADHDUFLAG | Total packets | Discarded packets |
| A | 0 | 2720 | 0 |
| B | 0 | 2720 | 0 |
| C | 0 | 2720 | 0 |
| D | 0 | 2720 | 0 |
| Mode M0 | |||
|---|---|---|---|
| Quadrant | BADHDUFLAG | Total packets | Discarded packets |
| A | 0 | 277686 | 0 |
| B | 0 | 315424 | 0 |
| C | 0 | 279224 | 0 |
| D | 0 | 308270 | 0 |
| Quadrant | Total seconds | Saturated seconds | Saturation percentage |
|---|---|---|---|
| A | 133300 | 1770 | 1.327832% |
| B | 133300 | 3518 | 2.639160% |
| C | 133301 | 1445 | 1.084013% |
| D | 133301 | 2694 | 2.020990% |
Noise dominated data is calculated using 1-second bins in cleaned event files. If a bin has >2000 counts, and if more than 50% of those come from <1% of pixels, then it is considered to be noise-dominated and hence unusable.
| Quadrant | # 1 sec bins | Bins with >0 counts | Bins with >2000 counts | High rate bins dominated by noise | Noise dominated (total time) | Noise dominated (detector-on time) | Marked lightcurve |
|---|---|---|---|---|---|---|---|
| A | 153425 | 133301 | 59 | 59 | 0.04% | 0.04% |  |
| B | 153425 | 133299 | 583 | 583 | 0.38% | 0.44% |  |
| C | 153425 | 133304 | 45 | 45 | 0.03% | 0.03% |  |
| D | 153425 | 133306 | 263 | 263 | 0.17% | 0.20% |  |
Top three noisy pixels from each quadrant. If the there are fewer than three noisy pixels in the level2.evt file, extra rows are filled as -1
| Pixel properties | Quadrant properties | ||||||
|---|---|---|---|---|---|---|---|
| Quadrant | DetID | PixID | Counts | Sigma | Mean | Median | Sigma |
| A | 0 | 50 | 715680 | 481.01 | 6686 | 6539 | 1474.3 |
| A | 15 | 174 | 91462 | 57.6 | 6686 | 6539 | 1474.3 |
| A | 7 | 16 | 90024 | 56.63 | 6686 | 6539 | 1474.3 |
| B | 15 | 204 | 5006087 | 3899.35 | 6715 | 6528 | 1282.2 |
| B | 5 | 172 | 3941971 | 3069.41 | 6715 | 6528 | 1282.2 |
| B | 0 | 214 | 1131949 | 877.76 | 6715 | 6528 | 1282.2 |
| C | 9 | 16 | 1065219 | 732.63 | 6560 | 6464 | 1445.1 |
| C | 1 | 16 | 208654 | 139.91 | 6560 | 6464 | 1445.1 |
| C | 3 | 9 | 172371 | 114.8 | 6560 | 6464 | 1445.1 |
| D | 2 | 152 | 4464980 | 2920.04 | 6587 | 6338 | 1526.9 |
| D | 8 | 195 | 1584870 | 1033.81 | 6587 | 6338 | 1526.9 |
| D | 0 | 11 | 1155792 | 752.8 | 6587 | 6338 | 1526.9 |
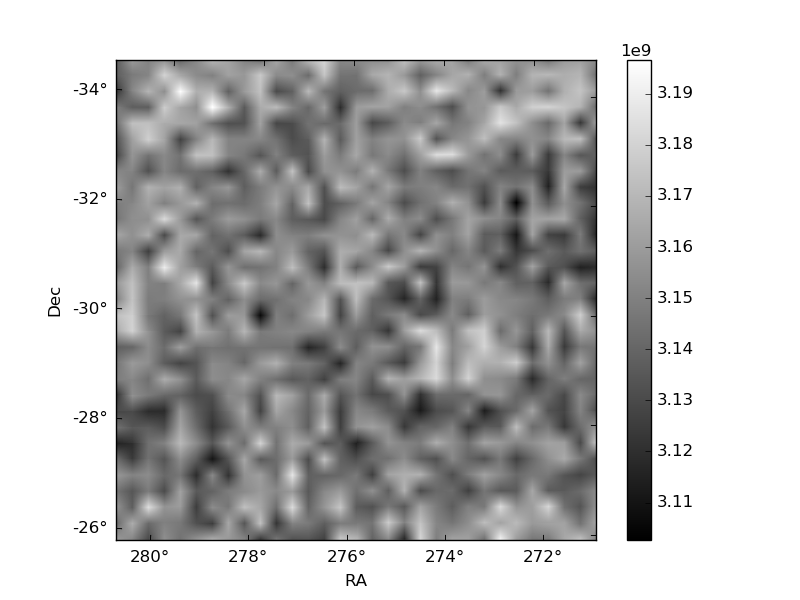
Histogram calculated using DETX and DETY for each event in the final _common_clean file
| Quadrant A |  |
 |
Quadrant B |
|---|---|---|---|
| Quadrant D |  |
 |
Quadrant C |
| Plot type | Count rate plots | Images |
|---|---|---|
| Comparison with Poisson distribution Blue bars denote a histogram of data divided into 1 sec bins. Red curve is a Poisson curve with rate = median count rate of data. |
 |
 |
| Quadrant-wise count rates Data is divided into 100 sec bins |
 |
|
| Module-wise count rates for Quadrant A Data is divided into 100 sec bins |
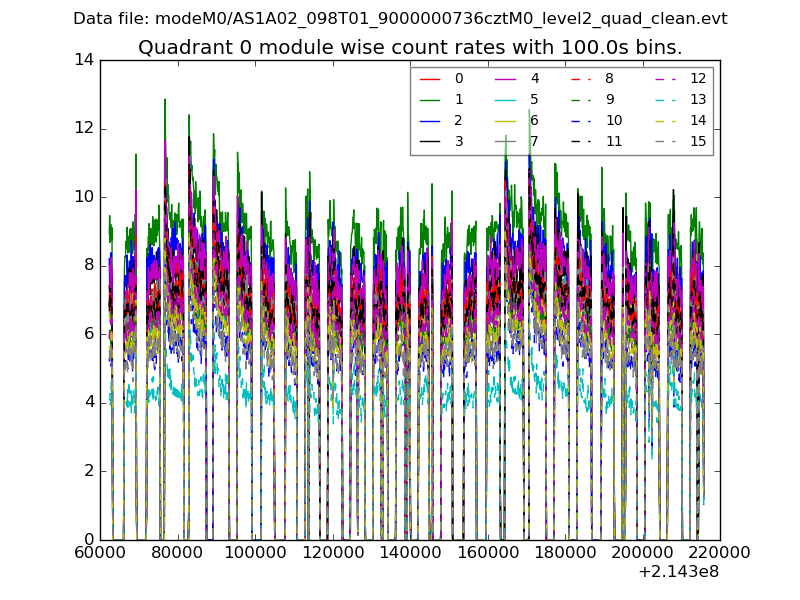 |
 |
| Module-wise count rates for Quadrant B Data is divided into 100 sec bins |
 |
 |
| Module-wise count rates for Quadrant C Data is divided into 100 sec bins |
 |
 |
| Module-wise count rates for Quadrant D Data is divided into 100 sec bins |
 |
 |
| Parameter | Plot |
|---|---|
| CZT HV Monitor | 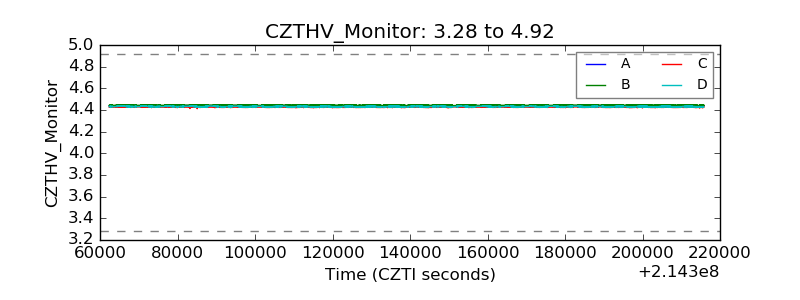 |
| D_VDD |  |
| Temperature 1 |  |
| Veto HV Monitor |  |
| Veto LLD |  |
| Alpha Counter |  |
| _CPM_Rate |  |
| CZT Counter |  |
| +2.5 Volts monitor |  |
| +5 Volts monitor |  |
| _ROLL_ROT |  |
| _Roll_DEC |  |
| _Roll_RA |  |
| Veto Counter |  |