| Param | Original file | Final file |
|---|---|---|
| Filename | modeM0/AS1G06_115T01_9000000734cztM0_level2.evt | modeM0/AS1G06_115T01_9000000734cztM0_level2_quad_clean.evt |
| Size (bytes) | 5,230,062,720 | 1,020,896,640 |
| Size | 4.9 GB | 973.6 MB |
| Events in quadrant A | 35,197,814 | 6,429,948 |
| Events in quadrant B | 40,520,771 | 6,486,757 |
| Events in quadrant C | 36,399,732 | 6,477,973 |
| Events in quadrant D | 41,028,554 | 6,199,946 |
| Mode M0 | |||
|---|---|---|---|
| Quadrant | BADHDUFLAG | Total packets | Discarded packets |
| A | 0 | 159434 | 0 |
| B | 0 | 171821 | 0 |
| C | 0 | 161861 | 0 |
| D | 0 | 176878 | 0 |
| Mode SS | |||
|---|---|---|---|
| Quadrant | BADHDUFLAG | Total packets | Discarded packets |
| A | 0 | 1583 | 0 |
| B | 0 | 1588 | 0 |
| C | 0 | 1582 | 0 |
| D | 0 | 1588 | 0 |
| Mode M9 | |||
|---|---|---|---|
| Quadrant | BADHDUFLAG | Total packets | Discarded packets |
| A | 0 | 112 | 0 |
| B | 0 | 112 | 0 |
| C | 0 | 112 | 0 |
| D | 0 | 112 | 0 |
| Quadrant | Total seconds | Saturated seconds | Saturation percentage |
|---|---|---|---|
| A | 77699 | 758 | 0.975560% |
| B | 77664 | 1463 | 1.883756% |
| C | 77700 | 612 | 0.787645% |
| D | 77715 | 1626 | 2.092260% |
Noise dominated data is calculated using 1-second bins in cleaned event files. If a bin has >2000 counts, and if more than 50% of those come from <1% of pixels, then it is considered to be noise-dominated and hence unusable.
| Quadrant | # 1 sec bins | Bins with >0 counts | Bins with >2000 counts | High rate bins dominated by noise | Noise dominated (total time) | Noise dominated (detector-on time) | Marked lightcurve |
|---|---|---|---|---|---|---|---|
| A | 89472 | 78115 | 9 | 9 | 0.01% | 0.01% | 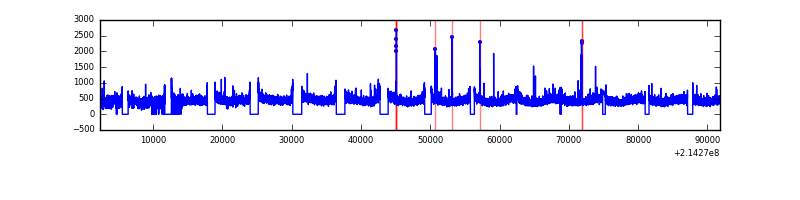 |
| B | 89472 | 78101 | 441 | 441 | 0.49% | 0.56% |  |
| C | 89472 | 78109 | 17 | 17 | 0.02% | 0.02% | 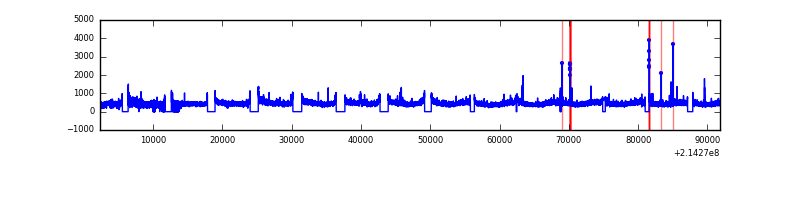 |
| D | 89472 | 78121 | 730 | 730 | 0.82% | 0.93% |  |
Top three noisy pixels from each quadrant. If the there are fewer than three noisy pixels in the level2.evt file, extra rows are filled as -1
| Pixel properties | Quadrant properties | ||||||
|---|---|---|---|---|---|---|---|
| Quadrant | DetID | PixID | Counts | Sigma | Mean | Median | Sigma |
| A | 0 | 50 | 135712 | 69.62 | 9053 | 8867 | 1822.1 |
| A | 12 | 194 | 87988 | 43.42 | 9053 | 8867 | 1822.1 |
| A | 0 | 226 | 87678 | 43.25 | 9053 | 8867 | 1822.1 |
| B | 15 | 204 | 1876848 | 1091.13 | 9121 | 8911 | 1711.9 |
| B | 5 | 172 | 1341402 | 778.36 | 9121 | 8911 | 1711.9 |
| B | 11 | 51 | 609388 | 350.76 | 9121 | 8911 | 1711.9 |
| C | 1 | 16 | 1792420 | 893.54 | 8792 | 8818 | 1996.1 |
| C | 3 | 9 | 139575 | 65.51 | 8792 | 8818 | 1996.1 |
| C | 13 | 61 | 71249 | 31.28 | 8792 | 8818 | 1996.1 |
| D | 2 | 152 | 2094942 | 983.96 | 8770 | 8499 | 2120.5 |
| D | 1 | 239 | 1703267 | 799.25 | 8770 | 8499 | 2120.5 |
| D | 2 | 14 | 796617 | 371.67 | 8770 | 8499 | 2120.5 |
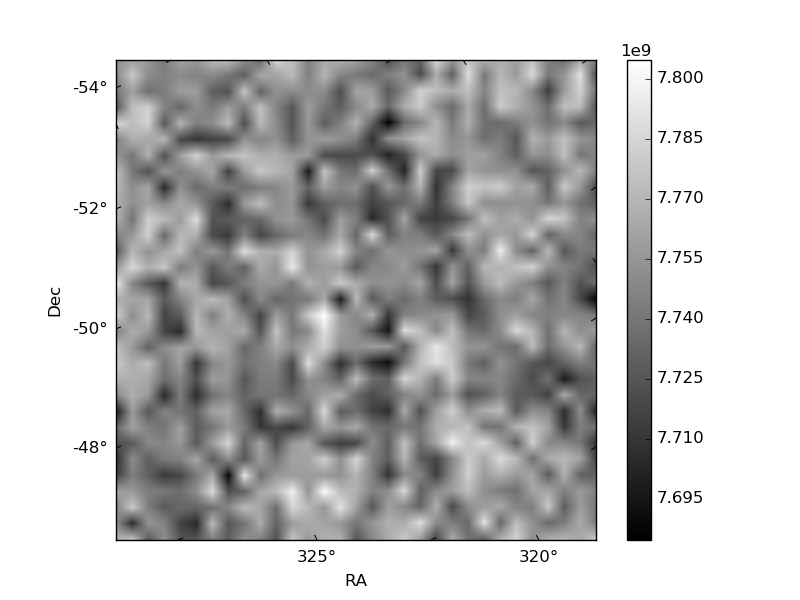
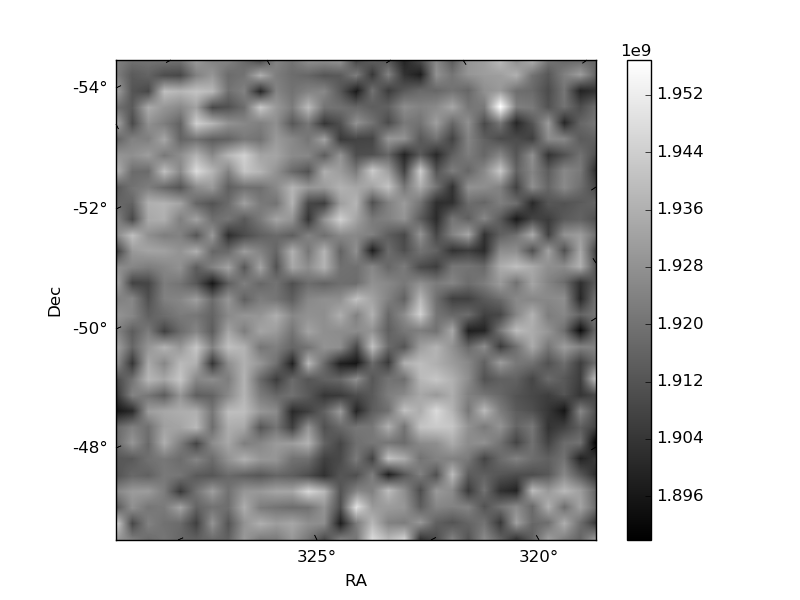
Histogram calculated using DETX and DETY for each event in the final _common_clean file
| Quadrant A |  |
 |
Quadrant B |
|---|---|---|---|
| Quadrant D |  |
 |
Quadrant C |
| Plot type | Count rate plots | Images |
|---|---|---|
| Comparison with Poisson distribution Blue bars denote a histogram of data divided into 1 sec bins. Red curve is a Poisson curve with rate = median count rate of data. |
 |
 |
| Quadrant-wise count rates Data is divided into 100 sec bins |
 |
|
| Module-wise count rates for Quadrant A Data is divided into 100 sec bins |
 |
 |
| Module-wise count rates for Quadrant B Data is divided into 100 sec bins |
 |
 |
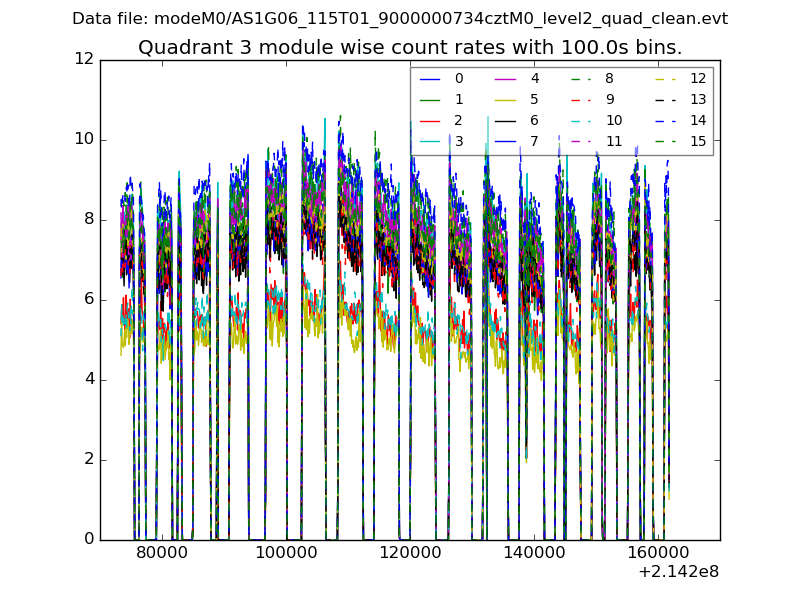
| Module-wise count rates for Quadrant C Data is divided into 100 sec bins |
 |
 |
| Module-wise count rates for Quadrant D Data is divided into 100 sec bins |
 |
 |
| Parameter | Plot |
|---|---|
| CZT HV Monitor | 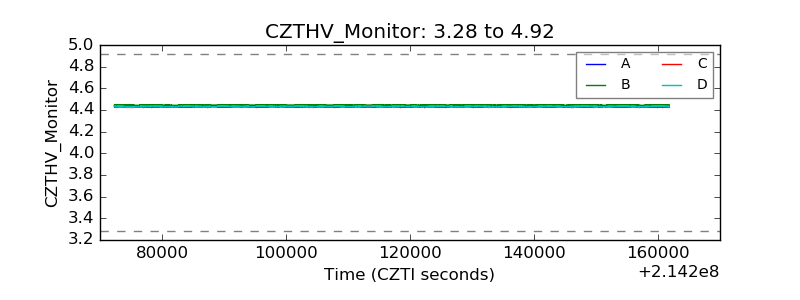 |
| D_VDD |  |
| Temperature 1 |  |
| Veto HV Monitor | 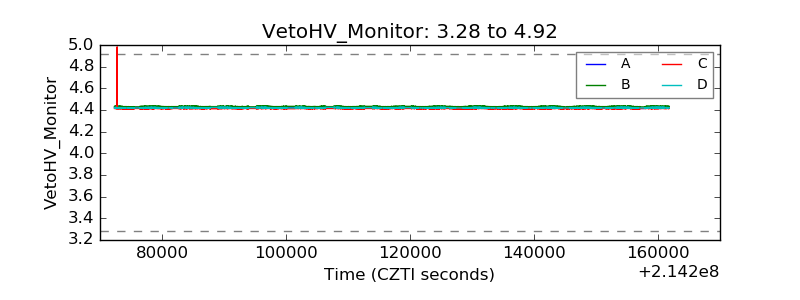 |
| Veto LLD | 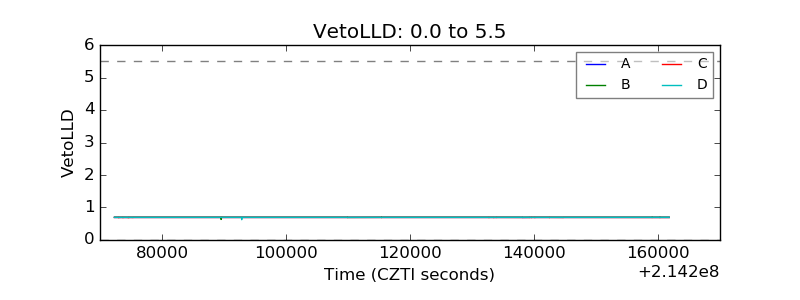 |
| Alpha Counter |  |
| _CPM_Rate | 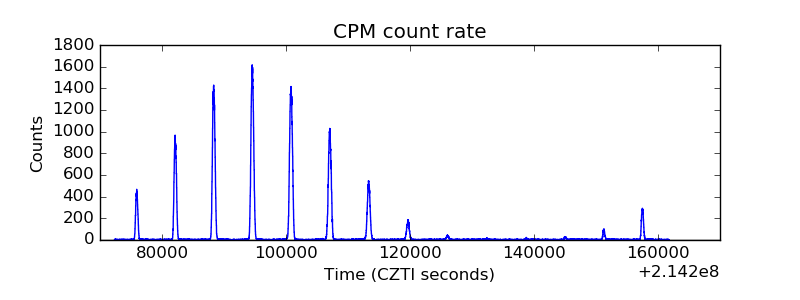 |
| CZT Counter |  |
| +2.5 Volts monitor |  |
| +5 Volts monitor |  |
| _ROLL_ROT |  |
| _Roll_DEC |  |
| _Roll_RA |  |
| Veto Counter |  |