| Param | Original file | Final file |
|---|---|---|
| Filename | modeM0/AS1A02_077T01_9000000732cztM0_level2_bc.evt | modeM0/AS1A02_077T01_9000000732cztM0_level2_quad_clean.evt |
| Size (bytes) | 3,246,500,160 | 1,184,353,920 |
| Size | 3.0 GB | 1.1 GB |
| Events in quadrant A | 19,294,882 | 7,678,545 |
| Events in quadrant B | 29,637,844 | 7,494,308 |
| Events in quadrant C | 18,496,076 | 7,055,186 |
| Events in quadrant D | 24,628,316 | 7,347,699 |
| Mode M0 | |||
|---|---|---|---|
| Quadrant | BADHDUFLAG | Total packets | Discarded packets |
| A | 0 | 197427 | 0 |
| B | 0 | 233686 | 0 |
| C | 0 | 177885 | 0 |
| D | 0 | 212137 | 0 |
| Mode SS | |||
|---|---|---|---|
| Quadrant | BADHDUFLAG | Total packets | Discarded packets |
| A | 0 | 1925 | 0 |
| B | 0 | 1928 | 0 |
| C | 0 | 1946 | 0 |
| D | 0 | 1914 | 0 |
| Mode M9 | |||
|---|---|---|---|
| Quadrant | BADHDUFLAG | Total packets | Discarded packets |
| A | 0 | 140 | 0 |
| B | 0 | 141 | 0 |
| C | 0 | 144 | 0 |
| D | 0 | 140 | 0 |
| Quadrant | Total seconds | Saturated seconds | Saturation percentage |
|---|---|---|---|
| A | 94482 | 1182 | 1.251032% |
| B | 94076 | 4097 | 4.354990% |
| C | 83886 | 841 | 1.002551% |
| D | 94016 | 1402 | 1.491236% |
Noise dominated data is calculated using 1-second bins in cleaned event files. If a bin has >2000 counts, and if more than 50% of those come from <1% of pixels, then it is considered to be noise-dominated and hence unusable.
| Quadrant | # 1 sec bins | Bins with >0 counts | Bins with >2000 counts | High rate bins dominated by noise | Noise dominated (total time) | Noise dominated (detector-on time) | Marked lightcurve |
|---|---|---|---|---|---|---|---|
| A | 135460 | 97949 | 16 | 16 | 0.01% | 0.02% |  |
| B | 135460 | 97554 | 769 | 769 | 0.57% | 0.79% |  |
| C | 116515 | 86415 | 31 | 31 | 0.03% | 0.04% |  |
| D | 135460 | 97490 | 131 | 131 | 0.10% | 0.13% |  |
Top three noisy pixels from each quadrant. If the there are fewer than three noisy pixels in the level2.evt file, extra rows are filled as -1
| Pixel properties | Quadrant properties | ||||||
|---|---|---|---|---|---|---|---|
| Quadrant | DetID | PixID | Counts | Sigma | Mean | Median | Sigma |
| A | 0 | 50 | 496198 | 470.35 | 4692 | 4590 | 1045.2 |
| A | 13 | 6 | 179709 | 167.55 | 4692 | 4590 | 1045.2 |
| A | 4 | 2 | 151862 | 140.9 | 4692 | 4590 | 1045.2 |
| B | 5 | 172 | 3065009 | 3440.03 | 4620 | 4480 | 889.7 |
| B | 10 | 245 | 2513416 | 2820.04 | 4620 | 4480 | 889.7 |
| B | 15 | 204 | 2128412 | 2387.3 | 4620 | 4480 | 889.7 |
| C | 1 | 16 | 1833117 | 2040.66 | 4084 | 4028 | 896.3 |
| C | 5 | 250 | 274223 | 301.45 | 4084 | 4028 | 896.3 |
| C | 10 | 34 | 200062 | 218.71 | 4084 | 4028 | 896.3 |
| D | 2 | 152 | 2679612 | 2461.85 | 4597 | 4423 | 1086.7 |
| D | 12 | 233 | 1132875 | 1038.46 | 4597 | 4423 | 1086.7 |
| D | 8 | 195 | 742274 | 679.01 | 4597 | 4423 | 1086.7 |
Histogram calculated using DETX and DETY for each event in the final _common_clean file
| Quadrant A |  |
 |
Quadrant B |
|---|---|---|---|
| Quadrant D |  |
 |
Quadrant C |
| Plot type | Count rate plots | Images |
|---|---|---|
| Comparison with Poisson distribution Blue bars denote a histogram of data divided into 1 sec bins. Red curve is a Poisson curve with rate = median count rate of data. |
 |
 |
| Quadrant-wise count rates Data is divided into 100 sec bins |
 |
|
| Module-wise count rates for Quadrant A Data is divided into 100 sec bins |
 |
 |
| Module-wise count rates for Quadrant B Data is divided into 100 sec bins |
 |
 |
| Module-wise count rates for Quadrant C Data is divided into 100 sec bins |
 |
 |
| Module-wise count rates for Quadrant D Data is divided into 100 sec bins |
 |
 |
| Parameter | Plot |
|---|---|
| CZT HV Monitor | 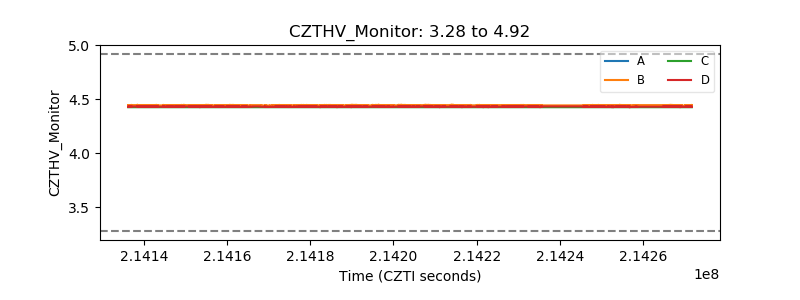 |
| D_VDD |  |
| Temperature 1 |  |
| Veto HV Monitor |  |
| Veto LLD | 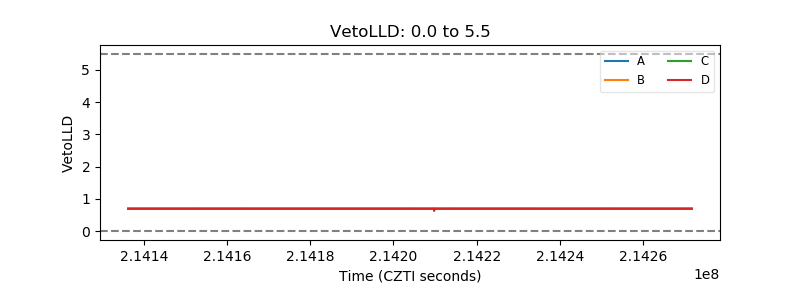 |
| Alpha Counter |  |
| _CPM_Rate |  |
| CZT Counter |  |
| +2.5 Volts monitor | 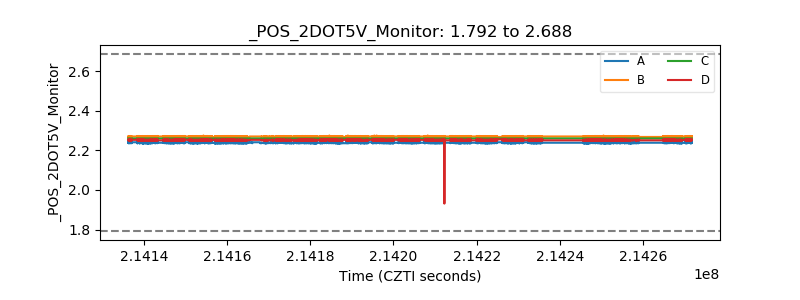 |
| +5 Volts monitor |  |
| _ROLL_ROT |  |
| _Roll_DEC |  |
| _Roll_RA |  |
| Veto Counter |  |