| Param | Original file | Final file |
|---|---|---|
| Filename | modeM0/AS1G06_132T01_9000000728cztM0_level2.evt | modeM0/AS1G06_132T01_9000000728cztM0_level2_quad_clean.evt |
| Size (bytes) | 344,548,800 | 70,165,440 |
| Size | 328.6 MB | 66.9 MB |
| Events in quadrant A | 2,384,738 | 444,548 |
| Events in quadrant B | 2,707,199 | 443,206 |
| Events in quadrant C | 2,343,005 | 435,717 |
| Events in quadrant D | 2,620,469 | 413,407 |
| Mode M0 | |||
|---|---|---|---|
| Quadrant | BADHDUFLAG | Total packets | Discarded packets |
| A | 0 | 11221 | 0 |
| B | 0 | 11688 | 0 |
| C | 0 | 11157 | 0 |
| D | 0 | 11927 | 0 |
| Mode SS | |||
|---|---|---|---|
| Quadrant | BADHDUFLAG | Total packets | Discarded packets |
| A | 0 | 114 | 0 |
| B | 0 | 146 | 0 |
| C | 0 | 156 | 0 |
| D | 0 | 138 | 0 |
| Mode M9 | |||
|---|---|---|---|
| Quadrant | BADHDUFLAG | Total packets | Discarded packets |
| A | 0 | 14 | 0 |
| B | 0 | 14 | 0 |
| C | 0 | 15 | 0 |
| D | 0 | 15 | 0 |
| Quadrant | Total seconds | Saturated seconds | Saturation percentage |
|---|---|---|---|
| A | 5500 | 49 | 0.890909% |
| B | 5450 | 56 | 1.027523% |
| C | 5461 | 17 | 0.311298% |
| D | 5364 | 40 | 0.745712% |
Noise dominated data is calculated using 1-second bins in cleaned event files. If a bin has >2000 counts, and if more than 50% of those come from <1% of pixels, then it is considered to be noise-dominated and hence unusable.
| Quadrant | # 1 sec bins | Bins with >0 counts | Bins with >2000 counts | High rate bins dominated by noise | Noise dominated (total time) | Noise dominated (detector-on time) | Marked lightcurve |
|---|---|---|---|---|---|---|---|
| A | 16855 | 6510 | 0 | 0 | 0.00% | 0.00% |  |
| B | 16853 | 6453 | 2 | 2 | 0.01% | 0.03% | 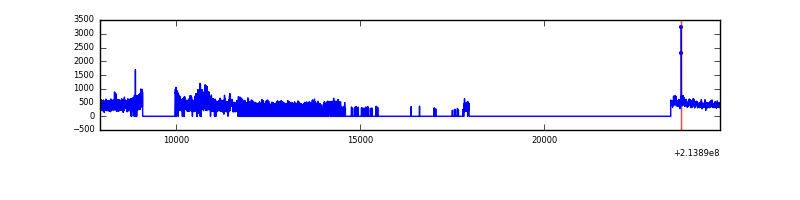 |
| C | 16855 | 6461 | 1 | 1 | 0.01% | 0.02% |  |
| D | 16855 | 6414 | 6 | 6 | 0.04% | 0.09% |  |
Top three noisy pixels from each quadrant. If the there are fewer than three noisy pixels in the level2.evt file, extra rows are filled as -1
| Pixel properties | Quadrant properties | ||||||
|---|---|---|---|---|---|---|---|
| Quadrant | DetID | PixID | Counts | Sigma | Mean | Median | Sigma |
| A | 14 | 31 | 6596 | 47.68 | 615 | 602 | 125.7 |
| A | 12 | 194 | 5982 | 42.8 | 615 | 602 | 125.7 |
| A | 0 | 226 | 5950 | 42.54 | 615 | 602 | 125.7 |
| B | 15 | 204 | 229197 | 1932.4 | 617 | 602 | 118.3 |
| B | 0 | 219 | 45660 | 380.89 | 617 | 602 | 118.3 |
| B | 0 | 214 | 23399 | 192.71 | 617 | 602 | 118.3 |
| C | 1 | 16 | 13219 | 91.52 | 591 | 592 | 138.0 |
| C | 8 | 128 | 8141 | 54.71 | 591 | 592 | 138.0 |
| C | 8 | 79 | 6547 | 43.16 | 591 | 592 | 138.0 |
| D | 1 | 20 | 213412 | 1509.16 | 575 | 556 | 141.0 |
| D | 2 | 136 | 80680 | 568.08 | 575 | 556 | 141.0 |
| D | 10 | 15 | 68694 | 483.1 | 575 | 556 | 141.0 |
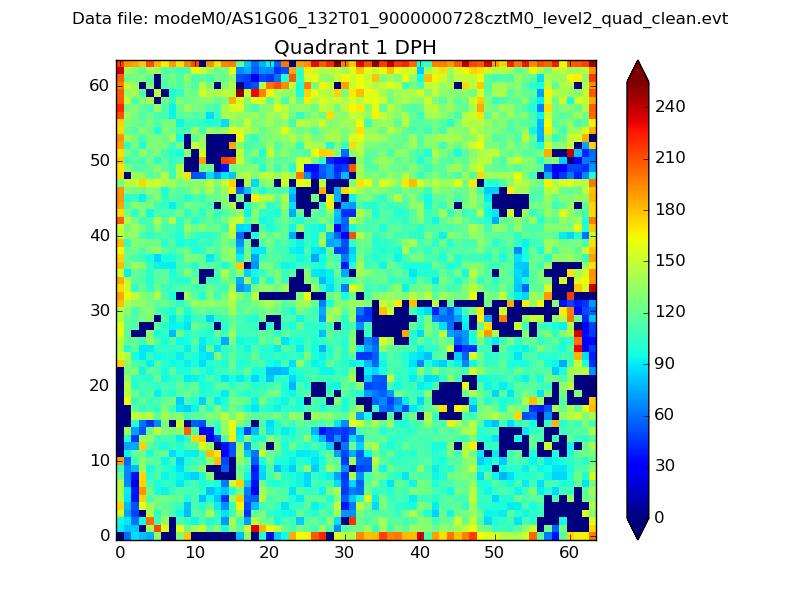
Histogram calculated using DETX and DETY for each event in the final _common_clean file
| Quadrant A |  |
 |
Quadrant B |
|---|---|---|---|
| Quadrant D |  |
 |
Quadrant C |
| Plot type | Count rate plots | Images |
|---|---|---|
| Comparison with Poisson distribution Blue bars denote a histogram of data divided into 1 sec bins. Red curve is a Poisson curve with rate = median count rate of data. |
 |
 |
| Quadrant-wise count rates Data is divided into 100 sec bins |
 |
|
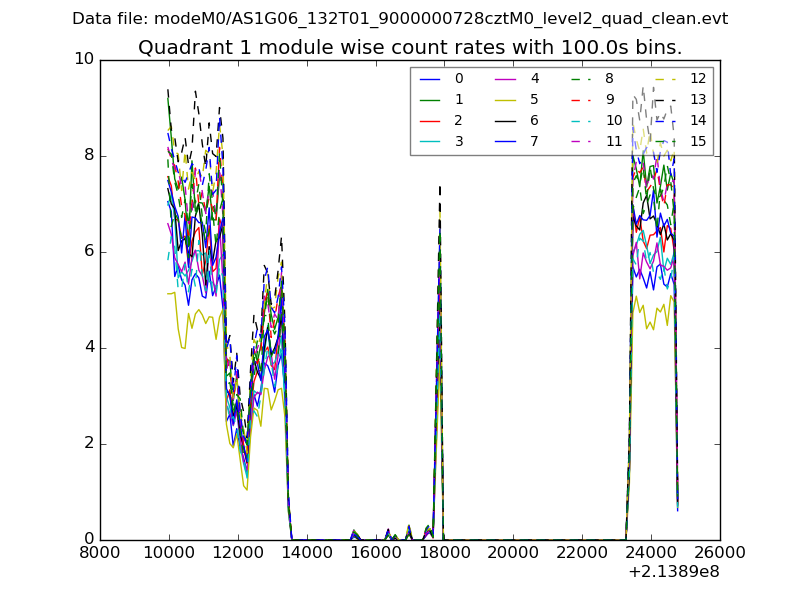
| Module-wise count rates for Quadrant A Data is divided into 100 sec bins |
 |
 |
| Module-wise count rates for Quadrant B Data is divided into 100 sec bins |
 |
 |
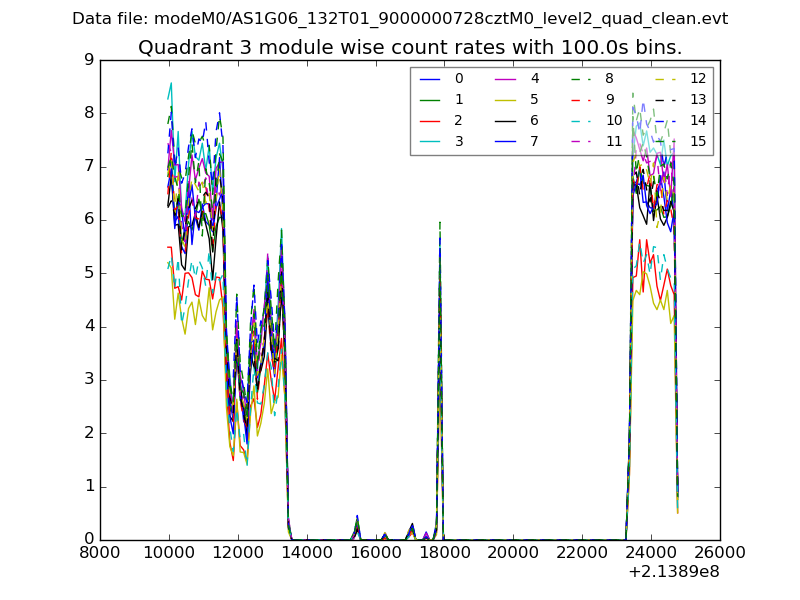
| Module-wise count rates for Quadrant C Data is divided into 100 sec bins |
 |
 |
| Module-wise count rates for Quadrant D Data is divided into 100 sec bins |
 |
 |
| Parameter | Plot |
|---|---|
| CZT HV Monitor | 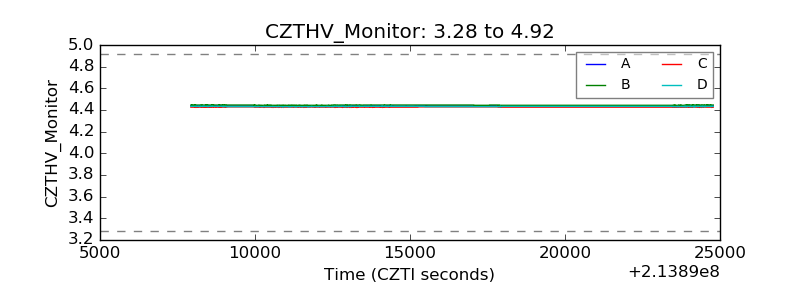 |
| D_VDD |  |
| Temperature 1 |  |
| Veto HV Monitor | 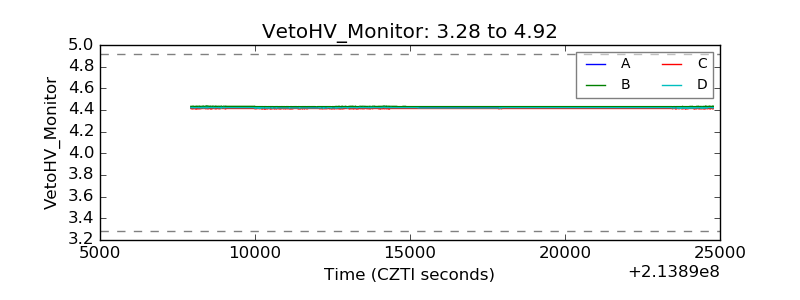 |
| Veto LLD | 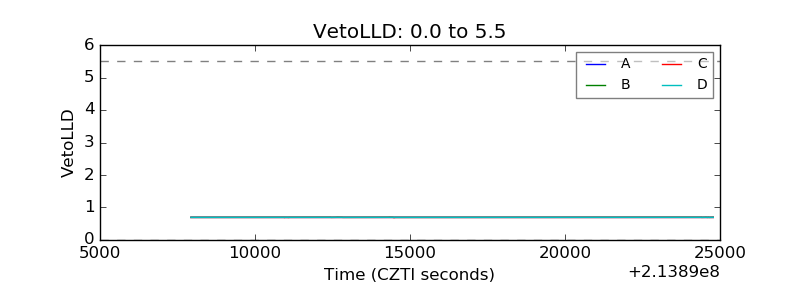 |
| Alpha Counter |  |
| _CPM_Rate |  |
| CZT Counter | 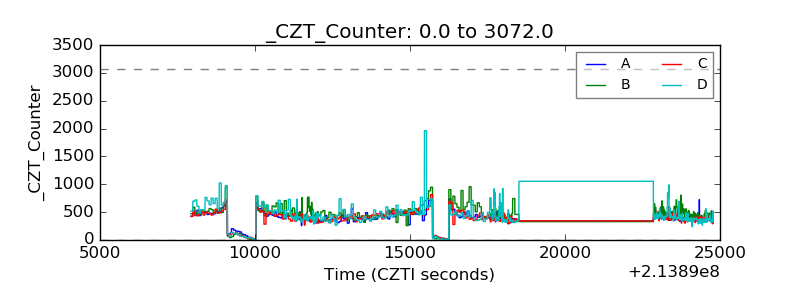 |
| +2.5 Volts monitor |  |
| +5 Volts monitor |  |
| _ROLL_ROT |  |
| _Roll_DEC |  |
| _Roll_RA |  |
| Veto Counter |  |