| Param | Original file | Final file |
|---|---|---|
| Filename | modeM0/AS1A02_028T01_9000000724cztM0_level2_bc.evt | modeM0/AS1A02_028T01_9000000724cztM0_level2_quad_clean.evt |
| Size (bytes) | 1,511,645,760 | 476,262,720 |
| Size | 1.4 GB | 454.2 MB |
| Events in quadrant A | 7,741,731 | 3,020,885 |
| Events in quadrant B | 9,581,679 | 3,030,356 |
| Events in quadrant C | 7,797,988 | 2,973,512 |
| Events in quadrant D | 18,046,214 | 2,768,902 |
| Mode SS | |||
|---|---|---|---|
| Quadrant | BADHDUFLAG | Total packets | Discarded packets |
| A | 0 | 780 | 0 |
| B | 0 | 780 | 0 |
| C | 0 | 780 | 0 |
| D | 0 | 780 | 0 |
| Mode M9 | |||
|---|---|---|---|
| Quadrant | BADHDUFLAG | Total packets | Discarded packets |
| A | 0 | 81 | 0 |
| B | 0 | 81 | 0 |
| C | 0 | 81 | 0 |
| D | 0 | 81 | 0 |
| Mode M0 | |||
|---|---|---|---|
| Quadrant | BADHDUFLAG | Total packets | Discarded packets |
| A | 0 | 79668 | 0 |
| B | 0 | 84991 | 0 |
| C | 0 | 79367 | 0 |
| D | 0 | 114450 | 0 |
| Quadrant | Total seconds | Saturated seconds | Saturation percentage |
|---|---|---|---|
| A | 38337 | 665 | 1.734617% |
| B | 38337 | 722 | 1.883298% |
| C | 38337 | 550 | 1.434645% |
| D | 38337 | 1134 | 2.957978% |
Noise dominated data is calculated using 1-second bins in cleaned event files. If a bin has >2000 counts, and if more than 50% of those come from <1% of pixels, then it is considered to be noise-dominated and hence unusable.
| Quadrant | # 1 sec bins | Bins with >0 counts | Bins with >2000 counts | High rate bins dominated by noise | Noise dominated (total time) | Noise dominated (detector-on time) | Marked lightcurve |
|---|---|---|---|---|---|---|---|
| A | 46137 | 38333 | 0 | 0 | 0.00% | 0.00% |  |
| B | 46137 | 38335 | 0 | 0 | 0.00% | 0.00% |  |
| C | 46137 | 38335 | 0 | 0 | 0.00% | 0.00% |  |
| D | 46137 | 38338 | 97 | 97 | 0.21% | 0.25% |  |
Top three noisy pixels from each quadrant. If the there are fewer than three noisy pixels in the level2.evt file, extra rows are filled as -1
| Pixel properties | Quadrant properties | ||||||
|---|---|---|---|---|---|---|---|
| Quadrant | DetID | PixID | Counts | Sigma | Mean | Median | Sigma |
| A | 13 | 14 | 89473 | 201.53 | 1984 | 1944 | 434.3 |
| A | 13 | 6 | 17071 | 34.83 | 1984 | 1944 | 434.3 |
| A | 12 | 194 | 16640 | 33.84 | 1984 | 1944 | 434.3 |
| B | 15 | 204 | 1213497 | 3205.02 | 1998 | 1939 | 378.0 |
| B | 8 | 3 | 566629 | 1493.82 | 1998 | 1939 | 378.0 |
| B | 0 | 219 | 44396 | 112.31 | 1998 | 1939 | 378.0 |
| C | 1 | 16 | 129241 | 299.42 | 1944 | 1916 | 425.2 |
| C | 7 | 247 | 34499 | 76.62 | 1944 | 1916 | 425.2 |
| C | 12 | 4 | 15016 | 30.81 | 1944 | 1916 | 425.2 |
| D | 2 | 63 | 9435504 | 21310.4 | 1919 | 1844 | 442.7 |
| D | 2 | 136 | 505753 | 1138.32 | 1919 | 1844 | 442.7 |
| D | 11 | 241 | 244719 | 548.65 | 1919 | 1844 | 442.7 |
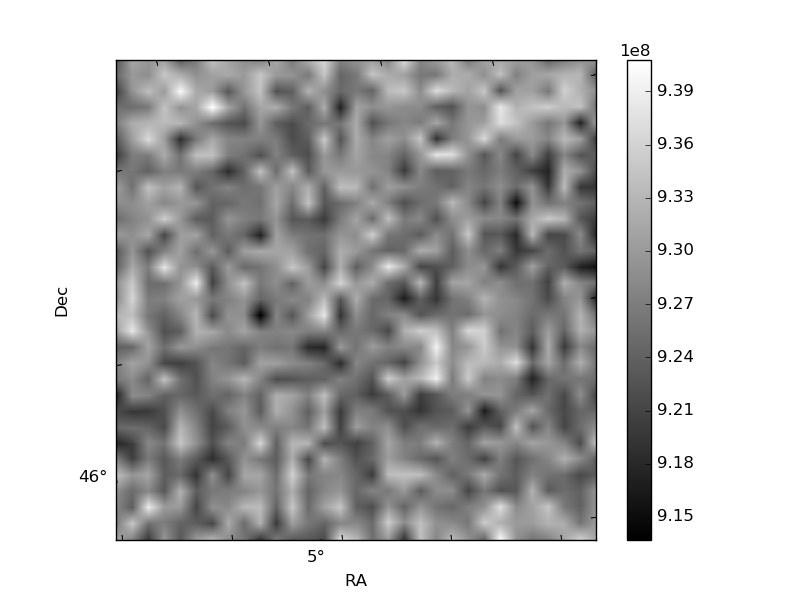
Histogram calculated using DETX and DETY for each event in the final _common_clean file
| Quadrant A |  |
 |
Quadrant B |
|---|---|---|---|
| Quadrant D |  |
 |
Quadrant C |
| Plot type | Count rate plots | Images |
|---|---|---|
| Comparison with Poisson distribution Blue bars denote a histogram of data divided into 1 sec bins. Red curve is a Poisson curve with rate = median count rate of data. |
 |
 |
| Quadrant-wise count rates Data is divided into 100 sec bins |
 |
|
| Module-wise count rates for Quadrant A Data is divided into 100 sec bins |
 |
 |
| Module-wise count rates for Quadrant B Data is divided into 100 sec bins |
 |
 |
| Module-wise count rates for Quadrant C Data is divided into 100 sec bins |
 |
 |
| Module-wise count rates for Quadrant D Data is divided into 100 sec bins |
 |
 |
| Parameter | Plot |
|---|---|
| CZT HV Monitor |  |
| D_VDD |  |
| Temperature 1 |  |
| Veto HV Monitor |  |
| Veto LLD |  |
| Alpha Counter | 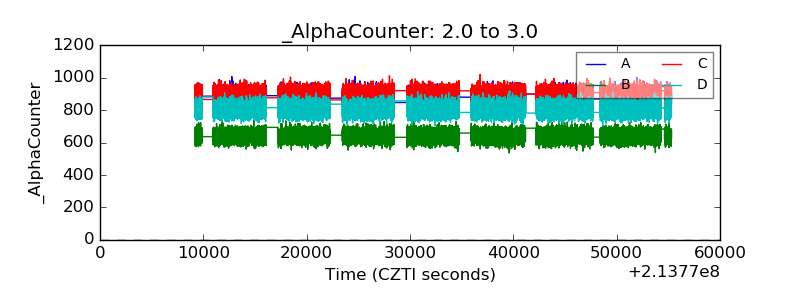 |
| _CPM_Rate |  |
| CZT Counter | 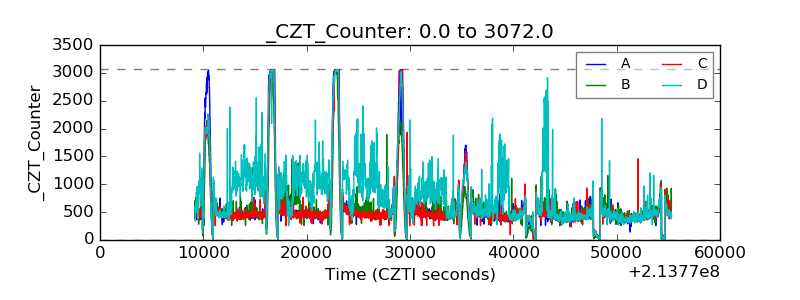 |
| +2.5 Volts monitor |  |
| +5 Volts monitor |  |
| _ROLL_ROT |  |
| _Roll_DEC |  |
| _Roll_RA |  |
| Veto Counter |  |