| Param | Original file | Final file |
|---|---|---|
| Filename | modeM0/AS1G06_129T01_9000000718cztM0_level2_bc.evt | modeM0/AS1G06_129T01_9000000718cztM0_level2_quad_clean.evt |
| Size (bytes) | 2,295,239,040 | 734,238,720 |
| Size | 2.1 GB | 700.2 MB |
| Events in quadrant A | 12,556,758 | 4,574,960 |
| Events in quadrant B | 18,780,634 | 4,557,851 |
| Events in quadrant C | 18,790,499 | 4,396,138 |
| Events in quadrant D | 15,032,164 | 4,331,326 |
| Mode M9 | |||
|---|---|---|---|
| Quadrant | BADHDUFLAG | Total packets | Discarded packets |
| A | 0 | 95 | 0 |
| B | 0 | 96 | 0 |
| C | 0 | 96 | 0 |
| D | 0 | 96 | 0 |
| Mode M0 | |||
|---|---|---|---|
| Quadrant | BADHDUFLAG | Total packets | Discarded packets |
| A | 0 | 131865 | 0 |
| B | 0 | 153942 | 0 |
| C | 0 | 154731 | 0 |
| D | 0 | 137760 | 0 |
| Mode SS | |||
|---|---|---|---|
| Quadrant | BADHDUFLAG | Total packets | Discarded packets |
| A | 0 | 1304 | 0 |
| B | 0 | 1304 | 0 |
| C | 0 | 1304 | 0 |
| D | 0 | 1304 | 0 |
| Quadrant | Total seconds | Saturated seconds | Saturation percentage |
|---|---|---|---|
| A | 63825 | 751 | 1.176655% |
| B | 63813 | 1770 | 2.773729% |
| C | 63832 | 2516 | 3.941597% |
| D | 63813 | 788 | 1.234858% |
Noise dominated data is calculated using 1-second bins in cleaned event files. If a bin has >2000 counts, and if more than 50% of those come from <1% of pixels, then it is considered to be noise-dominated and hence unusable.
| Quadrant | # 1 sec bins | Bins with >0 counts | Bins with >2000 counts | High rate bins dominated by noise | Noise dominated (total time) | Noise dominated (detector-on time) | Marked lightcurve |
|---|---|---|---|---|---|---|---|
| A | 73527 | 63853 | 14 | 14 | 0.02% | 0.02% |  |
| B | 73527 | 63853 | 265 | 265 | 0.36% | 0.42% |  |
| C | 73527 | 63859 | 530 | 530 | 0.72% | 0.83% |  |
| D | 73527 | 63855 | 60 | 60 | 0.08% | 0.09% |  |
Top three noisy pixels from each quadrant. If the there are fewer than three noisy pixels in the level2.evt file, extra rows are filled as -1
| Pixel properties | Quadrant properties | ||||||
|---|---|---|---|---|---|---|---|
| Quadrant | DetID | PixID | Counts | Sigma | Mean | Median | Sigma |
| A | 0 | 50 | 181696 | 259.81 | 3112 | 3037 | 687.6 |
| A | 13 | 14 | 161101 | 229.86 | 3112 | 3037 | 687.6 |
| A | 7 | 16 | 62445 | 86.39 | 3112 | 3037 | 687.6 |
| B | 15 | 204 | 2541774 | 4215.65 | 3123 | 3022 | 602.2 |
| B | 10 | 16 | 1214194 | 2011.18 | 3123 | 3022 | 602.2 |
| B | 5 | 172 | 1031495 | 1707.8 | 3123 | 3022 | 602.2 |
| C | 9 | 16 | 4811119 | 7282.27 | 2993 | 2944 | 660.3 |
| C | 1 | 241 | 1793048 | 2711.22 | 2993 | 2944 | 660.3 |
| C | 1 | 16 | 378098 | 568.19 | 2993 | 2944 | 660.3 |
| D | 8 | 195 | 1115477 | 1561.66 | 3061 | 2933 | 712.4 |
| D | 2 | 152 | 959124 | 1342.19 | 3061 | 2933 | 712.4 |
| D | 2 | 136 | 471507 | 657.73 | 3061 | 2933 | 712.4 |
Histogram calculated using DETX and DETY for each event in the final _common_clean file
| Quadrant A |  |
 |
Quadrant B |
|---|---|---|---|
| Quadrant D |  |
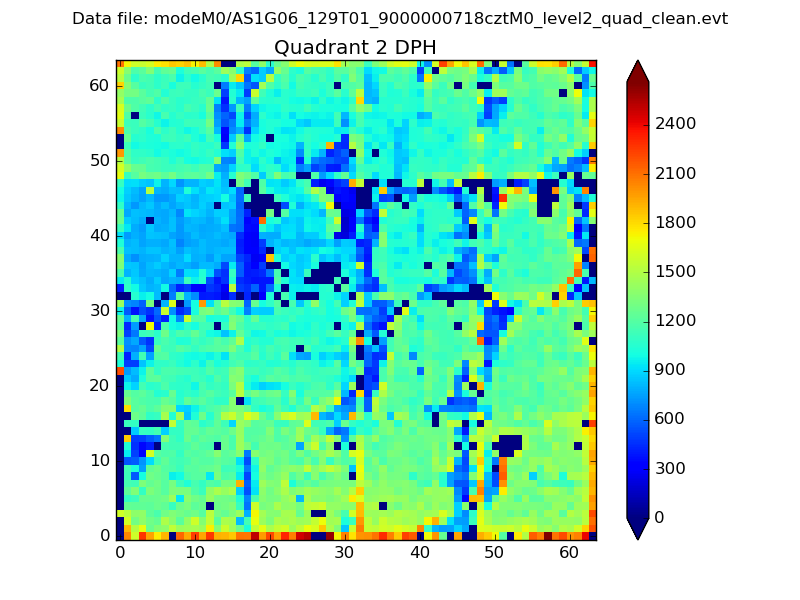 |
Quadrant C |
| Plot type | Count rate plots | Images |
|---|---|---|
| Comparison with Poisson distribution Blue bars denote a histogram of data divided into 1 sec bins. Red curve is a Poisson curve with rate = median count rate of data. |
 |
 |
| Quadrant-wise count rates Data is divided into 100 sec bins |
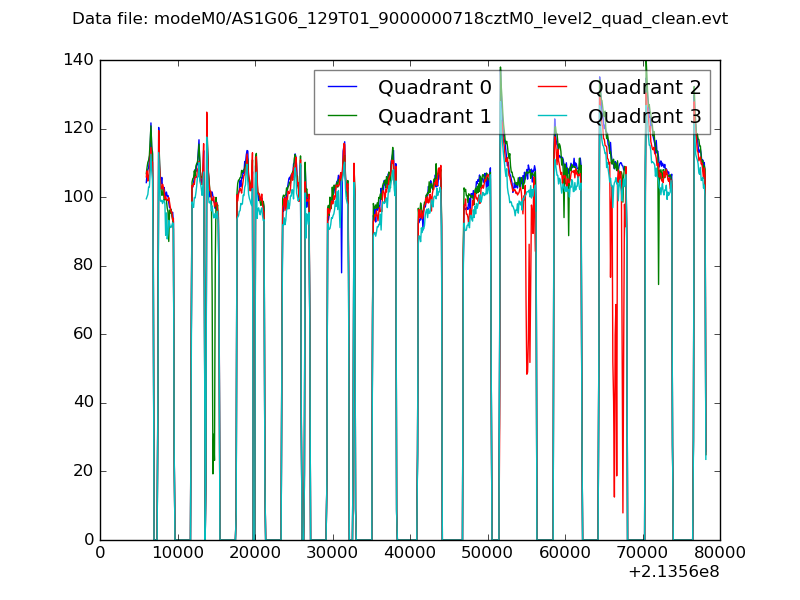 |
|
| Module-wise count rates for Quadrant A Data is divided into 100 sec bins |
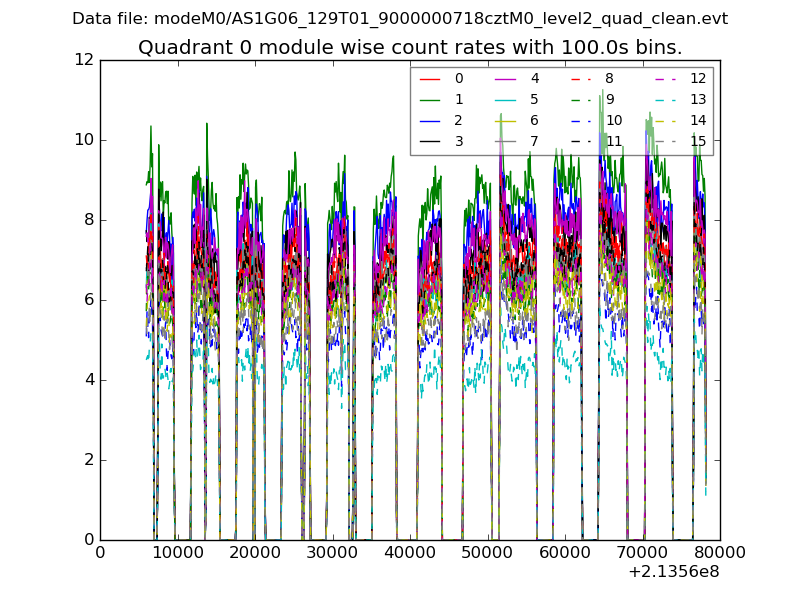 |
 |
| Module-wise count rates for Quadrant B Data is divided into 100 sec bins |
 |
 |
| Module-wise count rates for Quadrant C Data is divided into 100 sec bins |
 |
 |
| Module-wise count rates for Quadrant D Data is divided into 100 sec bins |
 |
 |
| Parameter | Plot |
|---|---|
| CZT HV Monitor |  |
| D_VDD |  |
| Temperature 1 |  |
| Veto HV Monitor |  |
| Veto LLD |  |
| Alpha Counter |  |
| _CPM_Rate |  |
| CZT Counter |  |
| +2.5 Volts monitor | 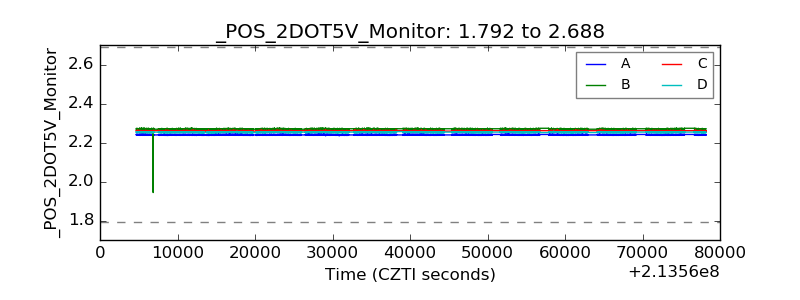 |
| +5 Volts monitor |  |
| _ROLL_ROT |  |
| _Roll_DEC | 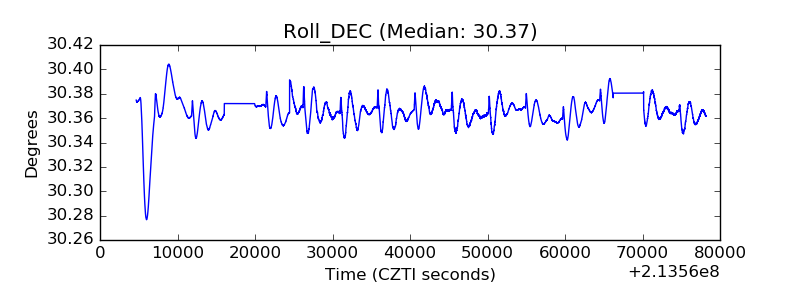 |
| _Roll_RA | 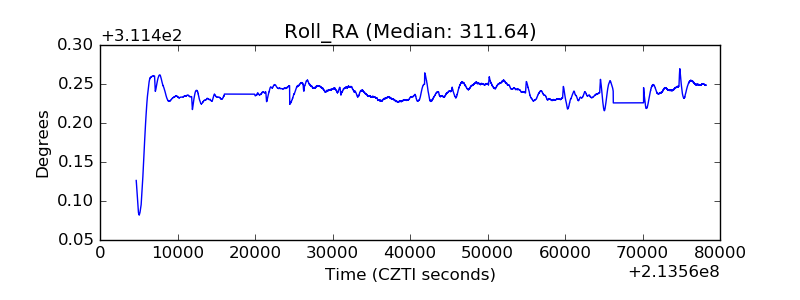 |
| Veto Counter |  |