| Param | Original file | Final file |
|---|---|---|
| Filename | modeM0/AS1G06_126T01_9000000716cztM0_level2_bc.evt | modeM0/AS1G06_126T01_9000000716cztM0_level2_quad_clean.evt |
| Size (bytes) | 200,194,560 | 57,738,240 |
| Size | 190.9 MB | 55.1 MB |
| Events in quadrant A | 1,161,461 | 336,940 |
| Events in quadrant B | 1,580,571 | 338,242 |
| Events in quadrant C | 1,210,861 | 336,766 |
| Events in quadrant D | 1,691,803 | 315,558 |
| Mode M9 | |||
|---|---|---|---|
| Quadrant | BADHDUFLAG | Total packets | Discarded packets |
| A | 0 | 9 | 0 |
| B | 0 | 9 | 0 |
| C | 0 | 9 | 0 |
| D | 0 | 9 | 0 |
| Mode SS | |||
|---|---|---|---|
| Quadrant | BADHDUFLAG | Total packets | Discarded packets |
| A | 0 | 124 | 0 |
| B | 0 | 124 | 0 |
| C | 0 | 124 | 0 |
| D | 0 | 124 | 0 |
| Mode M0 | |||
|---|---|---|---|
| Quadrant | BADHDUFLAG | Total packets | Discarded packets |
| A | 0 | 12471 | 0 |
| B | 0 | 13708 | 0 |
| C | 0 | 12575 | 0 |
| D | 0 | 14050 | 0 |
| Quadrant | Total seconds | Saturated seconds | Saturation percentage |
|---|---|---|---|
| A | 6018 | 53 | 0.880691% |
| B | 6018 | 89 | 1.478897% |
| C | 6018 | 42 | 0.697906% |
| D | 6018 | 120 | 1.994018% |
Noise dominated data is calculated using 1-second bins in cleaned event files. If a bin has >2000 counts, and if more than 50% of those come from <1% of pixels, then it is considered to be noise-dominated and hence unusable.
| Quadrant | # 1 sec bins | Bins with >0 counts | Bins with >2000 counts | High rate bins dominated by noise | Noise dominated (total time) | Noise dominated (detector-on time) | Marked lightcurve |
|---|---|---|---|---|---|---|---|
| A | 6968 | 6018 | 3 | 3 | 0.04% | 0.05% |  |
| B | 6968 | 6018 | 10 | 10 | 0.14% | 0.17% |  |
| C | 6968 | 6019 | 3 | 3 | 0.04% | 0.05% |  |
| D | 6968 | 6018 | 18 | 18 | 0.26% | 0.30% |  |
Top three noisy pixels from each quadrant. If the there are fewer than three noisy pixels in the level2.evt file, extra rows are filled as -1
| Pixel properties | Quadrant properties | ||||||
|---|---|---|---|---|---|---|---|
| Quadrant | DetID | PixID | Counts | Sigma | Mean | Median | Sigma |
| A | 7 | 16 | 31117 | 466.99 | 283 | 275 | 66.0 |
| A | 0 | 50 | 14049 | 208.56 | 283 | 275 | 66.0 |
| A | 3 | 1 | 11174 | 165.02 | 283 | 275 | 66.0 |
| B | 15 | 204 | 148232 | 2554.94 | 286 | 277 | 57.9 |
| B | 10 | 16 | 147877 | 2548.81 | 286 | 277 | 57.9 |
| B | 11 | 51 | 69581 | 1196.77 | 286 | 277 | 57.9 |
| C | 9 | 16 | 69058 | 1077.64 | 278 | 273 | 63.8 |
| C | 1 | 16 | 42045 | 654.43 | 278 | 273 | 63.8 |
| C | 7 | 159 | 4102 | 59.99 | 278 | 273 | 63.8 |
| D | 2 | 152 | 197244 | 2929.1 | 277 | 265 | 67.2 |
| D | 2 | 33 | 141661 | 2102.57 | 277 | 265 | 67.2 |
| D | 8 | 195 | 94923 | 1407.57 | 277 | 265 | 67.2 |
Histogram calculated using DETX and DETY for each event in the final _common_clean file
| Quadrant A |  |
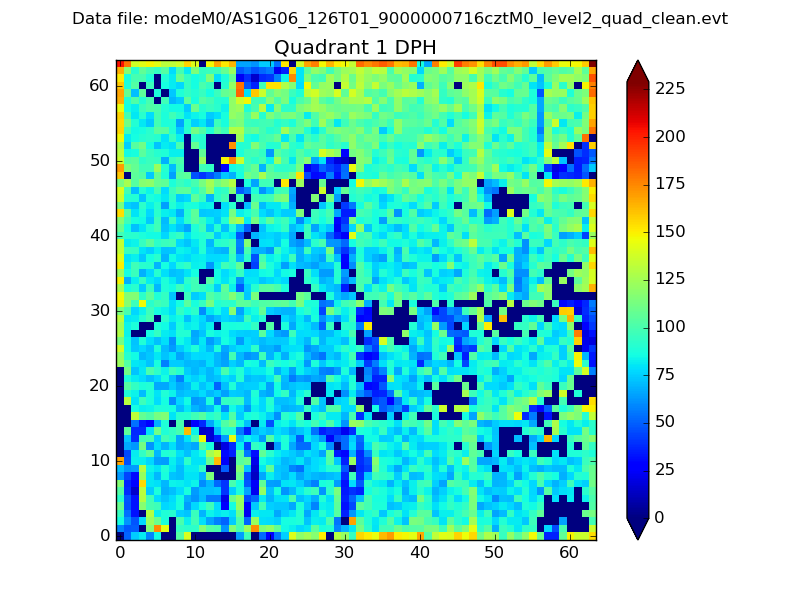 |
Quadrant B |
|---|---|---|---|
| Quadrant D |  |
 |
Quadrant C |
| Plot type | Count rate plots | Images |
|---|---|---|
| Comparison with Poisson distribution Blue bars denote a histogram of data divided into 1 sec bins. Red curve is a Poisson curve with rate = median count rate of data. |
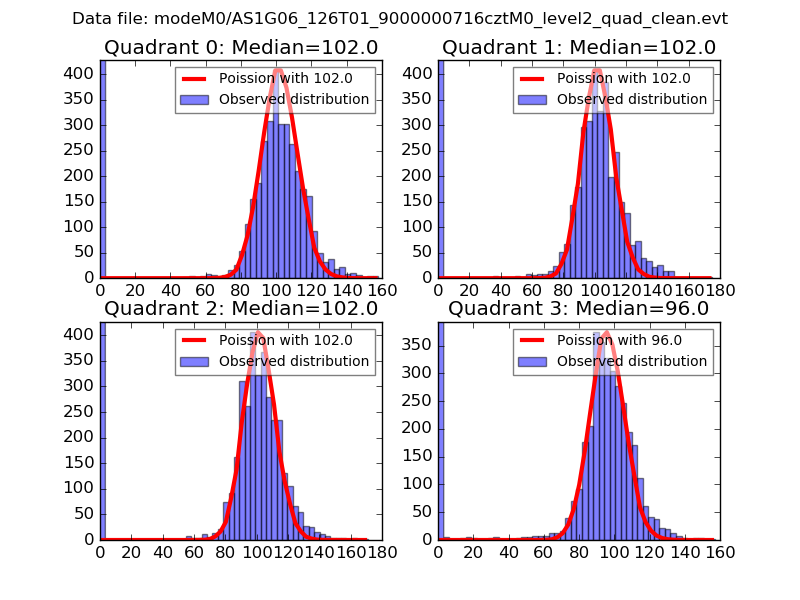 |
 |
| Quadrant-wise count rates Data is divided into 100 sec bins |
 |
|
| Module-wise count rates for Quadrant A Data is divided into 100 sec bins |
 |
 |
| Module-wise count rates for Quadrant B Data is divided into 100 sec bins |
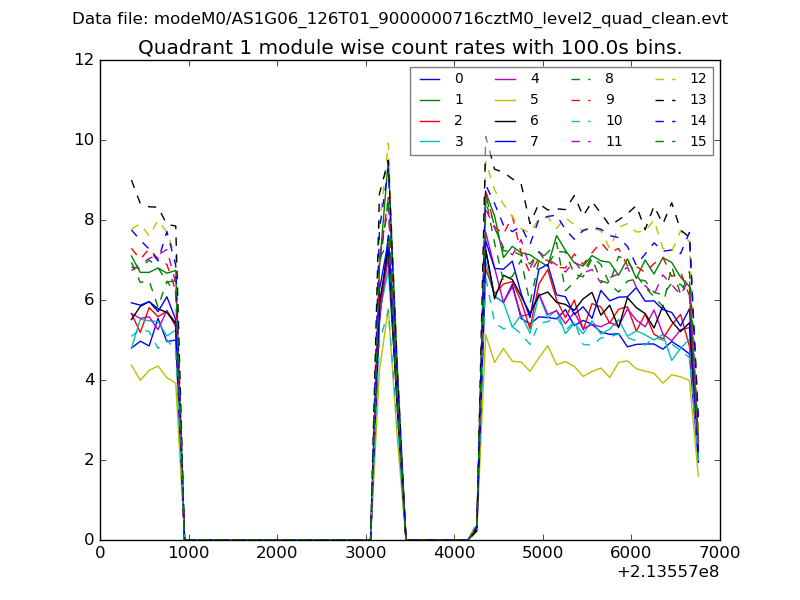 |
 |
| Module-wise count rates for Quadrant C Data is divided into 100 sec bins |
 |
 |
| Module-wise count rates for Quadrant D Data is divided into 100 sec bins |
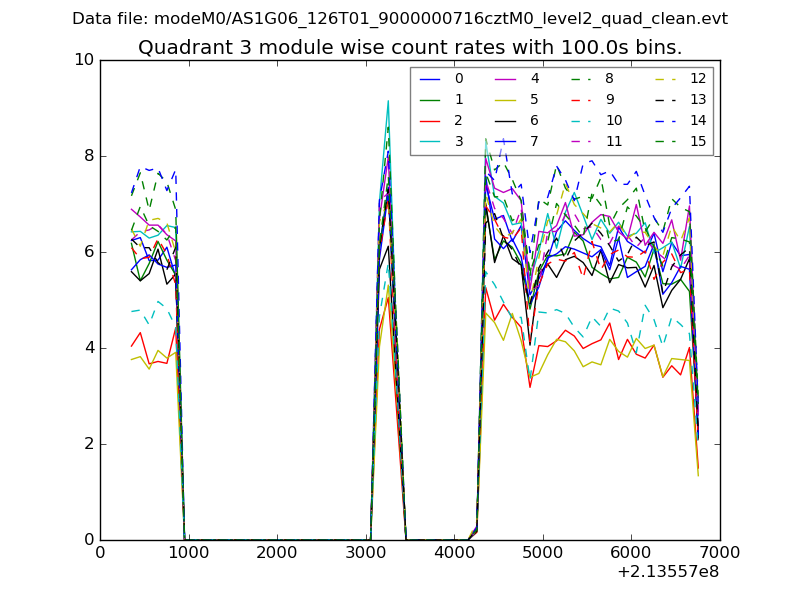 |
 |
| Parameter | Plot |
|---|---|
| CZT HV Monitor |  |
| D_VDD | 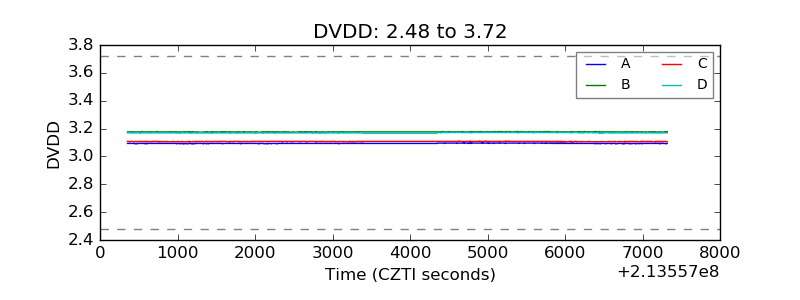 |
| Temperature 1 | 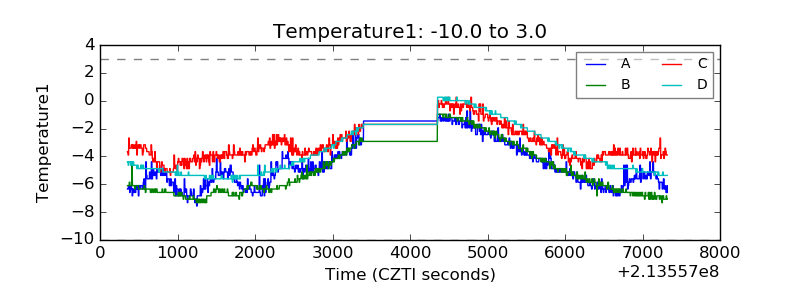 |
| Veto HV Monitor |  |
| Veto LLD |  |
| Alpha Counter |  |
| _CPM_Rate |  |
| CZT Counter |  |
| +2.5 Volts monitor | 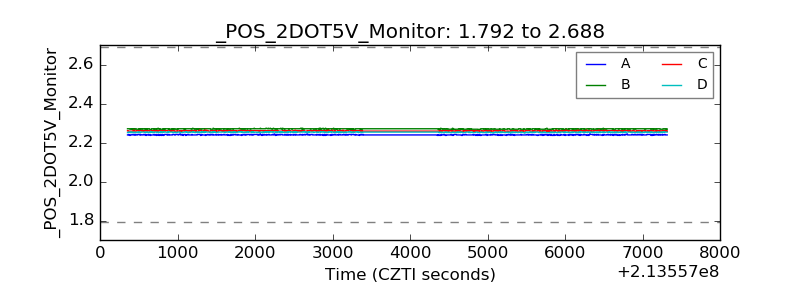 |
| +5 Volts monitor |  |
| _ROLL_ROT |  |
| _Roll_DEC | 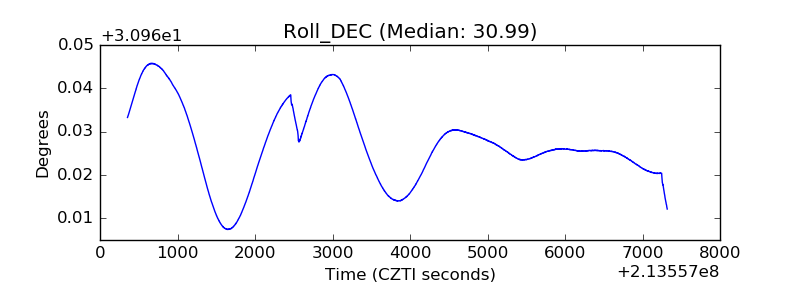 |
| _Roll_RA | 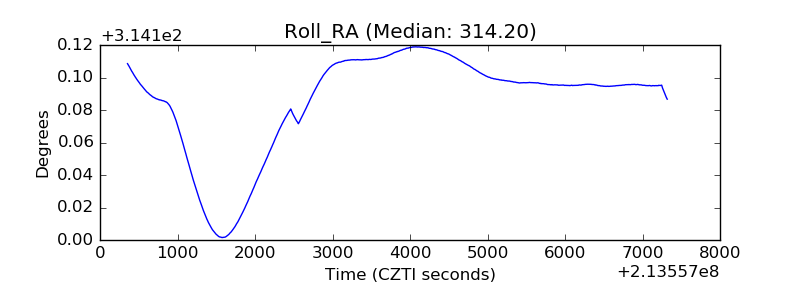 |
| Veto Counter |  |