| Param | Original file | Final file |
|---|---|---|
| Filename | modeM0/AS1A02_165T04_9000000712cztM0_level2_bc.evt | modeM0/AS1A02_165T04_9000000712cztM0_level2_quad_clean.evt |
| Size (bytes) | 230,379,840 | 54,305,280 |
| Size | 219.7 MB | 51.8 MB |
| Events in quadrant A | 1,106,741 | 313,298 |
| Events in quadrant B | 1,304,062 | 312,386 |
| Events in quadrant C | 1,156,367 | 308,219 |
| Events in quadrant D | 2,987,933 | 285,453 |
| Mode SS | |||
|---|---|---|---|
| Quadrant | BADHDUFLAG | Total packets | Discarded packets |
| A | 0 | 124 | 0 |
| B | 0 | 124 | 0 |
| C | 0 | 124 | 0 |
| D | 0 | 124 | 0 |
| Mode M9 | |||
|---|---|---|---|
| Quadrant | BADHDUFLAG | Total packets | Discarded packets |
| A | 0 | 8 | 0 |
| B | 0 | 8 | 0 |
| C | 0 | 8 | 0 |
| D | 0 | 8 | 0 |
| Mode M0 | |||
|---|---|---|---|
| Quadrant | BADHDUFLAG | Total packets | Discarded packets |
| A | 0 | 12504 | 0 |
| B | 0 | 12917 | 0 |
| C | 0 | 12545 | 0 |
| D | 0 | 18291 | 0 |
| Quadrant | Total seconds | Saturated seconds | Saturation percentage |
|---|---|---|---|
| A | 6081 | 35 | 0.575563% |
| B | 6081 | 54 | 0.888012% |
| C | 6081 | 23 | 0.378227% |
| D | 6081 | 323 | 5.311626% |
Noise dominated data is calculated using 1-second bins in cleaned event files. If a bin has >2000 counts, and if more than 50% of those come from <1% of pixels, then it is considered to be noise-dominated and hence unusable.
| Quadrant | # 1 sec bins | Bins with >0 counts | Bins with >2000 counts | High rate bins dominated by noise | Noise dominated (total time) | Noise dominated (detector-on time) | Marked lightcurve |
|---|---|---|---|---|---|---|---|
| A | 6861 | 6081 | 0 | 0 | 0.00% | 0.00% |  |
| B | 6861 | 6081 | 0 | 0 | 0.00% | 0.00% |  |
| C | 6861 | 6081 | 2 | 2 | 0.03% | 0.03% |  |
| D | 6861 | 6081 | 137 | 137 | 2.00% | 2.25% |  |
Top three noisy pixels from each quadrant. If the there are fewer than three noisy pixels in the level2.evt file, extra rows are filled as -1
| Pixel properties | Quadrant properties | ||||||
|---|---|---|---|---|---|---|---|
| Quadrant | DetID | PixID | Counts | Sigma | Mean | Median | Sigma |
| A | 12 | 194 | 2407 | 32.11 | 286 | 278 | 66.3 |
| A | 0 | 226 | 2103 | 27.52 | 286 | 278 | 66.3 |
| A | 13 | 14 | 2073 | 27.07 | 286 | 278 | 66.3 |
| B | 15 | 204 | 121707 | 2096.2 | 289 | 281 | 57.9 |
| B | 0 | 219 | 19524 | 332.2 | 289 | 281 | 57.9 |
| B | 10 | 246 | 17223 | 292.47 | 289 | 281 | 57.9 |
| C | 9 | 16 | 32582 | 495.51 | 282 | 276 | 65.2 |
| C | 1 | 16 | 15371 | 231.53 | 282 | 276 | 65.2 |
| C | 13 | 61 | 1861 | 24.31 | 282 | 276 | 65.2 |
| D | 2 | 152 | 767577 | 11426.66 | 277 | 265 | 67.2 |
| D | 2 | 63 | 667976 | 9943.43 | 277 | 265 | 67.2 |
| D | 2 | 33 | 354387 | 5273.52 | 277 | 265 | 67.2 |
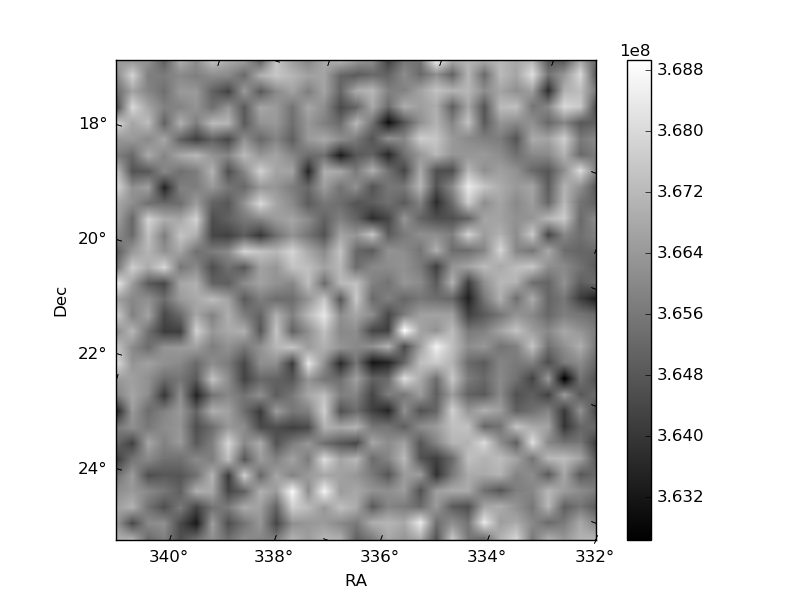
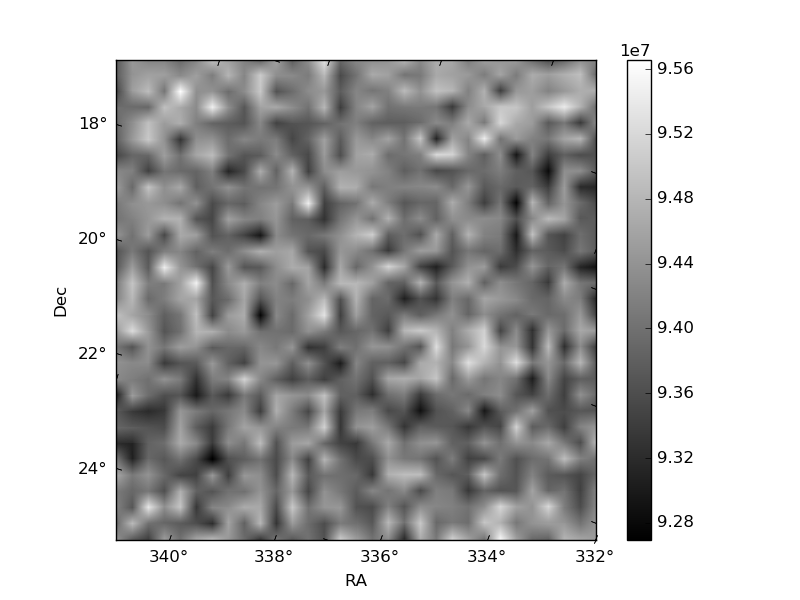
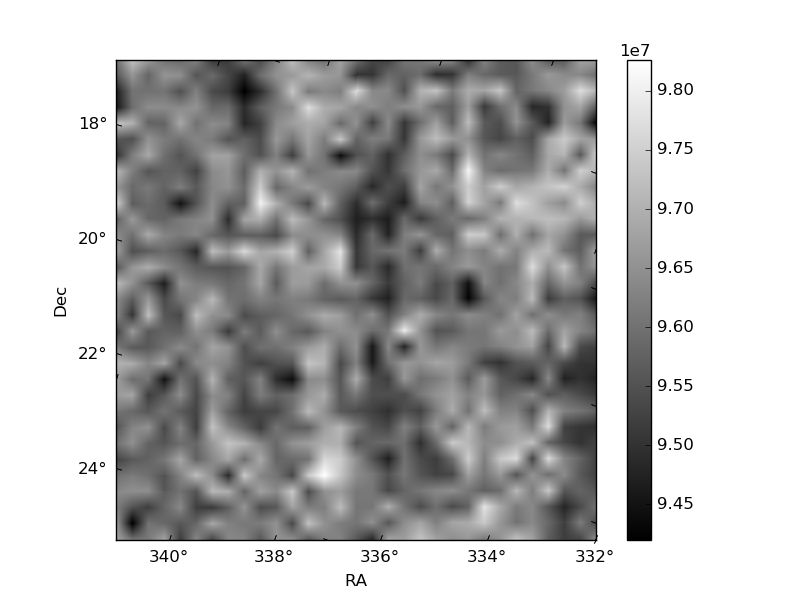
Histogram calculated using DETX and DETY for each event in the final _common_clean file
| Quadrant A |  |
 |
Quadrant B |
|---|---|---|---|
| Quadrant D |  |
 |
Quadrant C |
| Plot type | Count rate plots | Images |
|---|---|---|
| Comparison with Poisson distribution Blue bars denote a histogram of data divided into 1 sec bins. Red curve is a Poisson curve with rate = median count rate of data. |
 |
 |
| Quadrant-wise count rates Data is divided into 100 sec bins |
 |
|
| Module-wise count rates for Quadrant A Data is divided into 100 sec bins |
 |
 |
| Module-wise count rates for Quadrant B Data is divided into 100 sec bins |
 |
 |
| Module-wise count rates for Quadrant C Data is divided into 100 sec bins |
 |
 |
| Module-wise count rates for Quadrant D Data is divided into 100 sec bins |
 |
 |
| Parameter | Plot |
|---|---|
| CZT HV Monitor |  |
| D_VDD |  |
| Temperature 1 | 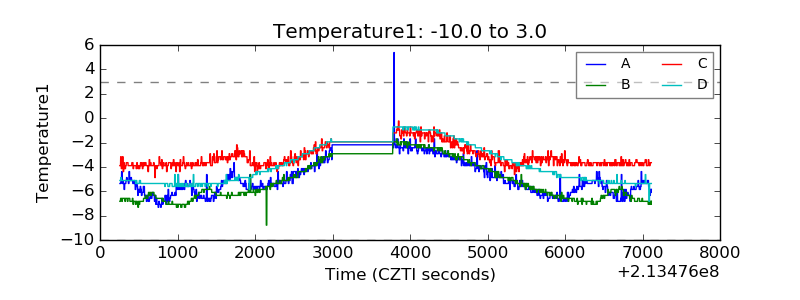 |
| Veto HV Monitor |  |
| Veto LLD |  |
| Alpha Counter |  |
| _CPM_Rate | 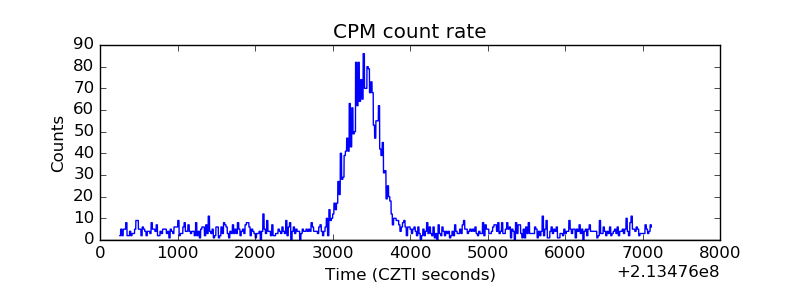 |
| CZT Counter | 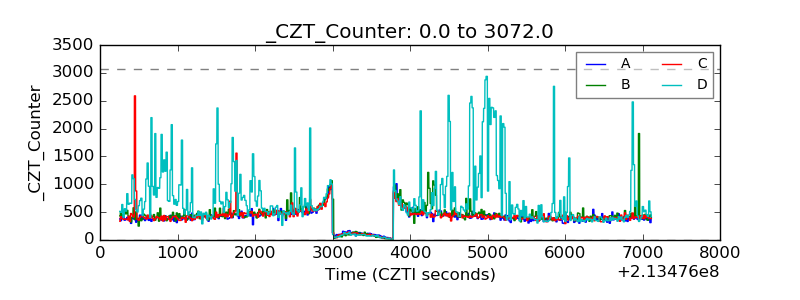 |
| +2.5 Volts monitor |  |
| +5 Volts monitor |  |
| _ROLL_ROT |  |
| _Roll_DEC | 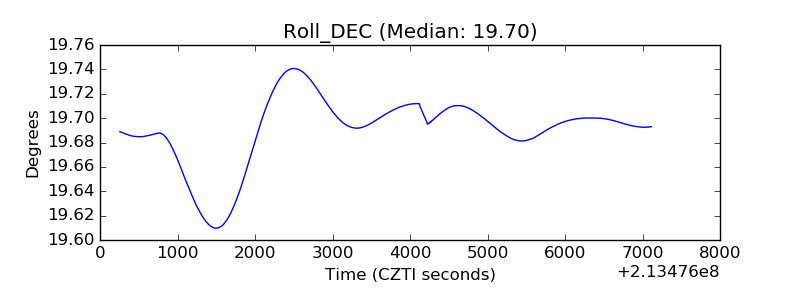 |
| _Roll_RA |  |
| Veto Counter |  |