| Param | Original file | Final file |
|---|---|---|
| Filename | modeM0/AS1A02_086T01_9000000714cztM0_level2.evt | modeM0/AS1A02_086T01_9000000714cztM0_level2_quad_clean.evt |
| Size (bytes) | 4,284,457,920 | 770,025,600 |
| Size | 4.0 GB | 734.4 MB |
| Events in quadrant A | 28,753,229 | 4,878,826 |
| Events in quadrant B | 34,380,774 | 4,906,566 |
| Events in quadrant C | 26,865,199 | 4,898,797 |
| Events in quadrant D | 35,790,884 | 4,605,903 |
| Mode SS | |||
|---|---|---|---|
| Quadrant | BADHDUFLAG | Total packets | Discarded packets |
| A | 0 | 1202 | 0 |
| B | 0 | 1202 | 0 |
| C | 0 | 1202 | 0 |
| D | 0 | 1202 | 0 |
| Mode M0 | |||
|---|---|---|---|
| Quadrant | BADHDUFLAG | Total packets | Discarded packets |
| A | 0 | 126044 | 0 |
| B | 0 | 140557 | 0 |
| C | 0 | 121547 | 0 |
| D | 0 | 146870 | 0 |
| Mode M9 | |||
|---|---|---|---|
| Quadrant | BADHDUFLAG | Total packets | Discarded packets |
| A | 0 | 97 | 0 |
| B | 0 | 97 | 0 |
| C | 0 | 97 | 0 |
| D | 0 | 97 | 0 |
| Quadrant | Total seconds | Saturated seconds | Saturation percentage |
|---|---|---|---|
| A | 58797 | 1114 | 1.894654% |
| B | 58797 | 1552 | 2.639590% |
| C | 58797 | 560 | 0.952430% |
| D | 58797 | 2080 | 3.537595% |
Noise dominated data is calculated using 1-second bins in cleaned event files. If a bin has >2000 counts, and if more than 50% of those come from <1% of pixels, then it is considered to be noise-dominated and hence unusable.
| Quadrant | # 1 sec bins | Bins with >0 counts | Bins with >2000 counts | High rate bins dominated by noise | Noise dominated (total time) | Noise dominated (detector-on time) | Marked lightcurve |
|---|---|---|---|---|---|---|---|
| A | 72435 | 58810 | 276 | 276 | 0.38% | 0.47% |  |
| B | 72435 | 58811 | 476 | 476 | 0.66% | 0.81% |  |
| C | 72435 | 58811 | 5 | 5 | 0.01% | 0.01% |  |
| D | 72435 | 58811 | 1130 | 1130 | 1.56% | 1.92% | 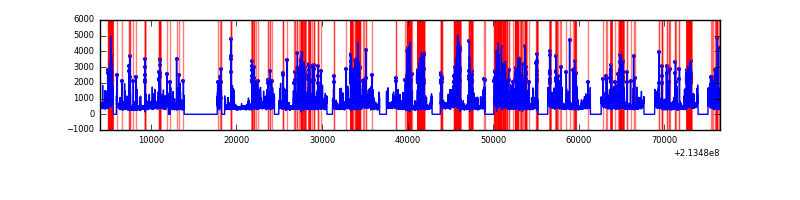 |
Top three noisy pixels from each quadrant. If the there are fewer than three noisy pixels in the level2.evt file, extra rows are filled as -1
| Pixel properties | Quadrant properties | ||||||
|---|---|---|---|---|---|---|---|
| Quadrant | DetID | PixID | Counts | Sigma | Mean | Median | Sigma |
| A | 15 | 174 | 947434 | 660.51 | 6999 | 6852 | 1424.0 |
| A | 0 | 50 | 731612 | 508.95 | 6999 | 6852 | 1424.0 |
| A | 0 | 226 | 70664 | 44.81 | 6999 | 6852 | 1424.0 |
| B | 15 | 204 | 3307264 | 2456.26 | 7044 | 6877 | 1343.7 |
| B | 10 | 16 | 1862597 | 1381.09 | 7044 | 6877 | 1343.7 |
| B | 0 | 219 | 574506 | 422.45 | 7044 | 6877 | 1343.7 |
| C | 1 | 16 | 240280 | 149.9 | 6762 | 6788 | 1557.6 |
| C | 9 | 16 | 89252 | 52.94 | 6762 | 6788 | 1557.6 |
| C | 13 | 61 | 55086 | 31.01 | 6762 | 6788 | 1557.6 |
| D | 2 | 63 | 3453075 | 2112.43 | 6717 | 6509 | 1631.6 |
| D | 2 | 152 | 2727011 | 1667.42 | 6717 | 6509 | 1631.6 |
| D | 2 | 136 | 1092108 | 665.37 | 6717 | 6509 | 1631.6 |
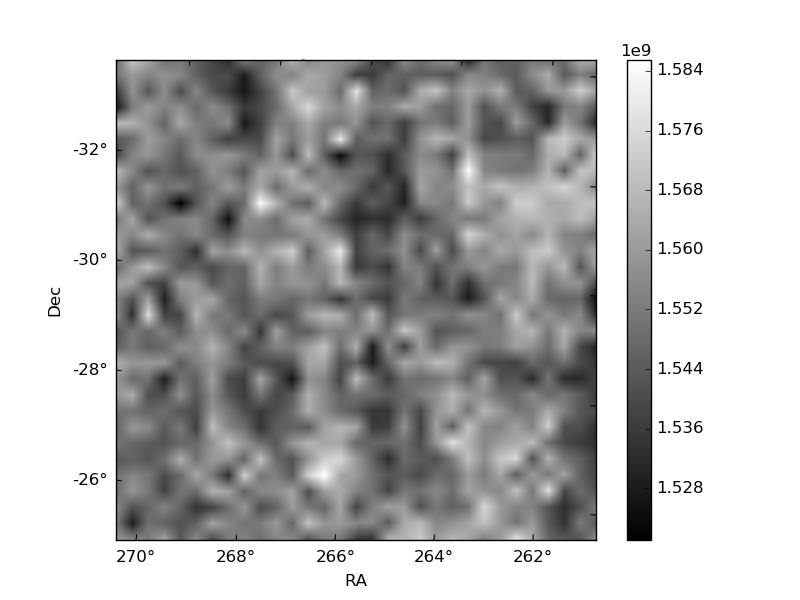
Histogram calculated using DETX and DETY for each event in the final _common_clean file
| Quadrant A |  |
 |
Quadrant B |
|---|---|---|---|
| Quadrant D |  |
 |
Quadrant C |
| Plot type | Count rate plots | Images |
|---|---|---|
| Comparison with Poisson distribution Blue bars denote a histogram of data divided into 1 sec bins. Red curve is a Poisson curve with rate = median count rate of data. |
 |
 |
| Quadrant-wise count rates Data is divided into 100 sec bins |
 |
|
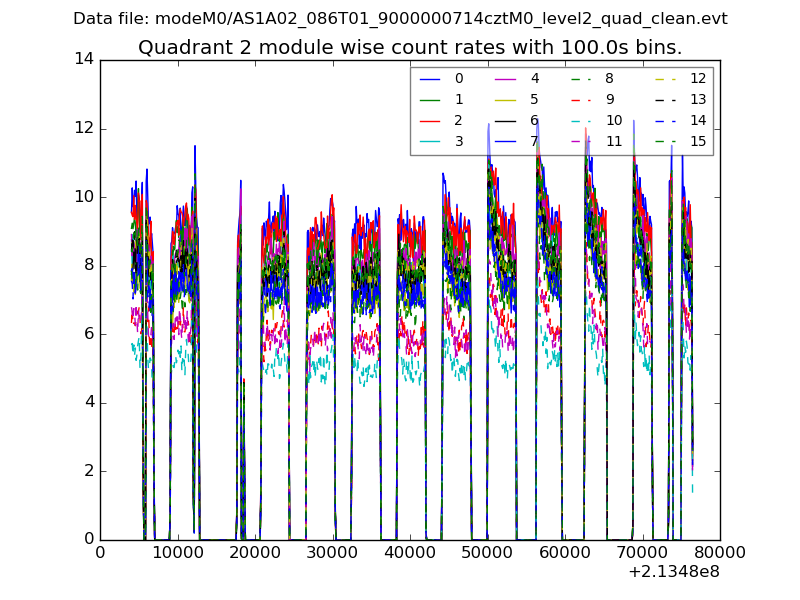
| Module-wise count rates for Quadrant A Data is divided into 100 sec bins |
 |
 |
| Module-wise count rates for Quadrant B Data is divided into 100 sec bins |
 |
 |
| Module-wise count rates for Quadrant C Data is divided into 100 sec bins |
 |
 |
| Module-wise count rates for Quadrant D Data is divided into 100 sec bins |
 |
 |
| Parameter | Plot |
|---|---|
| CZT HV Monitor |  |
| D_VDD |  |
| Temperature 1 |  |
| Veto HV Monitor | 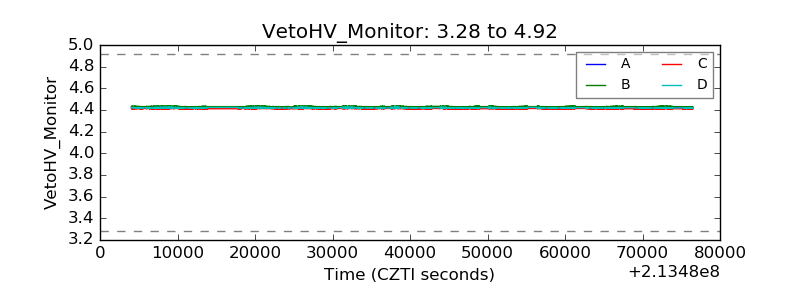 |
| Veto LLD |  |
| Alpha Counter |  |
| _CPM_Rate |  |
| CZT Counter |  |
| +2.5 Volts monitor |  |
| +5 Volts monitor |  |
| _ROLL_ROT |  |
| _Roll_DEC |  |
| _Roll_RA |  |
| Veto Counter |  |