| Param | Original file | Final file |
|---|---|---|
| Filename | modeM0/AS1G06_084T01_9000000710cztM0_level2_bc.evt | modeM0/AS1G06_084T01_9000000710cztM0_level2_quad_clean.evt |
| Size (bytes) | 2,762,544,960 | 998,421,120 |
| Size | 2.6 GB | 952.2 MB |
| Events in quadrant A | 15,151,291 | 6,263,649 |
| Events in quadrant B | 21,076,134 | 6,275,988 |
| Events in quadrant C | 18,635,863 | 6,267,033 |
| Events in quadrant D | 23,438,499 | 6,044,494 |
| Mode M0 | |||
|---|---|---|---|
| Quadrant | BADHDUFLAG | Total packets | Discarded packets |
| A | 0 | 162602 | 0 |
| B | 0 | 179935 | 0 |
| C | 0 | 171149 | 0 |
| D | 0 | 190351 | 0 |
| Mode M9 | |||
|---|---|---|---|
| Quadrant | BADHDUFLAG | Total packets | Discarded packets |
| A | 0 | 133 | 0 |
| B | 0 | 137 | 0 |
| C | 0 | 137 | 0 |
| D | 0 | 136 | 0 |
| Mode SS | |||
|---|---|---|---|
| Quadrant | BADHDUFLAG | Total packets | Discarded packets |
| A | 0 | 1608 | 0 |
| B | 0 | 1614 | 0 |
| C | 0 | 1620 | 0 |
| D | 0 | 1600 | 0 |
| Quadrant | Total seconds | Saturated seconds | Saturation percentage |
|---|---|---|---|
| A | 78671 | 949 | 1.206289% |
| B | 78537 | 1518 | 1.932847% |
| C | 78594 | 1550 | 1.972161% |
| D | 78397 | 2194 | 2.798576% |
Noise dominated data is calculated using 1-second bins in cleaned event files. If a bin has >2000 counts, and if more than 50% of those come from <1% of pixels, then it is considered to be noise-dominated and hence unusable.
| Quadrant | # 1 sec bins | Bins with >0 counts | Bins with >2000 counts | High rate bins dominated by noise | Noise dominated (total time) | Noise dominated (detector-on time) | Marked lightcurve |
|---|---|---|---|---|---|---|---|
| A | 97580 | 81621 | 6 | 6 | 0.01% | 0.01% |  |
| B | 97580 | 81558 | 35 | 35 | 0.04% | 0.04% |  |
| C | 97580 | 81543 | 743 | 743 | 0.76% | 0.91% |  |
| D | 97580 | 81480 | 250 | 250 | 0.26% | 0.31% |  |
Top three noisy pixels from each quadrant. If the there are fewer than three noisy pixels in the level2.evt file, extra rows are filled as -1
| Pixel properties | Quadrant properties | ||||||
|---|---|---|---|---|---|---|---|
| Quadrant | DetID | PixID | Counts | Sigma | Mean | Median | Sigma |
| A | 7 | 16 | 131389 | 147.21 | 3869 | 3779 | 866.8 |
| A | 0 | 50 | 85519 | 94.3 | 3869 | 3779 | 866.8 |
| A | 12 | 194 | 33379 | 34.15 | 3869 | 3779 | 866.8 |
| B | 15 | 204 | 3362444 | 4487.68 | 3896 | 3778 | 748.4 |
| B | 10 | 246 | 1651985 | 2202.25 | 3896 | 3778 | 748.4 |
| B | 4 | 48 | 298559 | 393.87 | 3896 | 3778 | 748.4 |
| C | 1 | 241 | 2431723 | 2933.54 | 3796 | 3752 | 827.7 |
| C | 1 | 16 | 771314 | 927.39 | 3796 | 3752 | 827.7 |
| C | 9 | 16 | 503581 | 603.91 | 3796 | 3752 | 827.7 |
| D | 2 | 63 | 4101489 | 4618.66 | 3819 | 3664 | 887.2 |
| D | 2 | 152 | 1211005 | 1360.79 | 3819 | 3664 | 887.2 |
| D | 11 | 192 | 675424 | 757.14 | 3819 | 3664 | 887.2 |
Histogram calculated using DETX and DETY for each event in the final _common_clean file
| Quadrant A |  |
 |
Quadrant B |
|---|---|---|---|
| Quadrant D |  |
 |
Quadrant C |
| Plot type | Count rate plots | Images |
|---|---|---|
| Comparison with Poisson distribution Blue bars denote a histogram of data divided into 1 sec bins. Red curve is a Poisson curve with rate = median count rate of data. |
 |
 |
| Quadrant-wise count rates Data is divided into 100 sec bins |
 |
|
| Module-wise count rates for Quadrant A Data is divided into 100 sec bins |
 |
 |
| Module-wise count rates for Quadrant B Data is divided into 100 sec bins |
 |
 |
| Module-wise count rates for Quadrant C Data is divided into 100 sec bins |
 |
 |
| Module-wise count rates for Quadrant D Data is divided into 100 sec bins |
 |
 |
| Parameter | Plot |
|---|---|
| CZT HV Monitor |  |
| D_VDD |  |
| Temperature 1 | 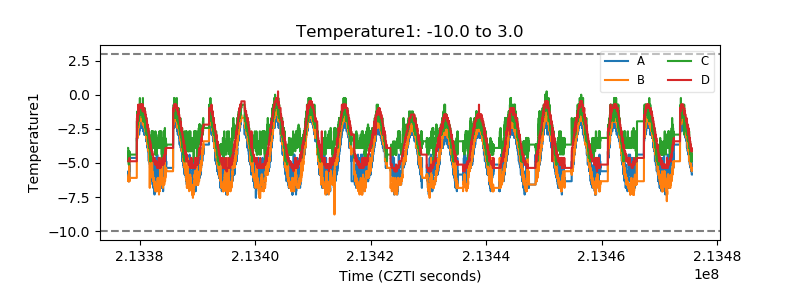 |
| Veto HV Monitor |  |
| Veto LLD |  |
| Alpha Counter |  |
| _CPM_Rate |  |
| CZT Counter |  |
| +2.5 Volts monitor |  |
| +5 Volts monitor | 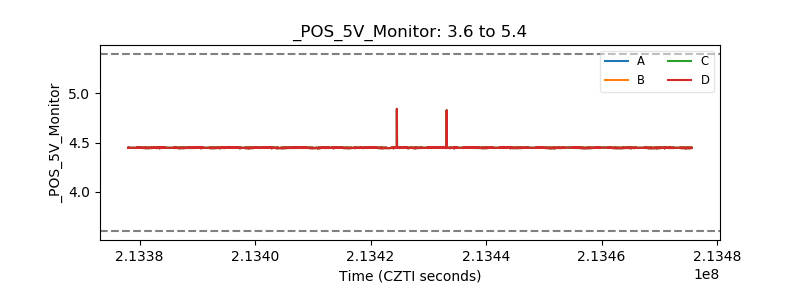 |
| _ROLL_ROT |  |
| _Roll_DEC |  |
| _Roll_RA |  |
| Veto Counter |  |