| Param | Original file | Final file |
|---|---|---|
| Filename | modeM0/AS1A02_199T01_9000000708cztM0_level2_bc.evt | modeM0/AS1A02_199T01_9000000708cztM0_level2_quad_clean.evt |
| Size (bytes) | 1,391,356,800 | 486,190,080 |
| Size | 1.3 GB | 463.7 MB |
| Events in quadrant A | 7,034,573 | 3,205,094 |
| Events in quadrant B | 9,932,155 | 3,178,186 |
| Events in quadrant C | 7,197,442 | 3,062,981 |
| Events in quadrant D | 15,549,533 | 2,840,383 |
| Mode M0 | |||
|---|---|---|---|
| Quadrant | BADHDUFLAG | Total packets | Discarded packets |
| A | 0 | 73035 | 0 |
| B | 0 | 81389 | 0 |
| C | 0 | 73313 | 0 |
| D | 0 | 108175 | 0 |
| Mode M9 | |||
|---|---|---|---|
| Quadrant | BADHDUFLAG | Total packets | Discarded packets |
| A | 0 | 60 | 0 |
| B | 0 | 60 | 0 |
| C | 0 | 60 | 0 |
| D | 0 | 59 | 0 |
| Mode SS | |||
|---|---|---|---|
| Quadrant | BADHDUFLAG | Total packets | Discarded packets |
| A | 0 | 724 | 0 |
| B | 0 | 722 | 0 |
| C | 0 | 726 | 0 |
| D | 0 | 722 | 0 |
| Quadrant | Total seconds | Saturated seconds | Saturation percentage |
|---|---|---|---|
| A | 35512 | 400 | 1.126380% |
| B | 35502 | 559 | 1.574559% |
| C | 35516 | 287 | 0.808086% |
| D | 35447 | 3878 | 10.940277% |
Noise dominated data is calculated using 1-second bins in cleaned event files. If a bin has >2000 counts, and if more than 50% of those come from <1% of pixels, then it is considered to be noise-dominated and hence unusable.
| Quadrant | # 1 sec bins | Bins with >0 counts | Bins with >2000 counts | High rate bins dominated by noise | Noise dominated (total time) | Noise dominated (detector-on time) | Marked lightcurve |
|---|---|---|---|---|---|---|---|
| A | 41477 | 35575 | 12 | 12 | 0.03% | 0.03% |  |
| B | 41477 | 35577 | 22 | 22 | 0.05% | 0.06% |  |
| C | 41477 | 35576 | 1 | 1 | 0.00% | 0.00% |  |
| D | 41477 | 35572 | 46 | 46 | 0.11% | 0.13% |  |
Top three noisy pixels from each quadrant. If the there are fewer than three noisy pixels in the level2.evt file, extra rows are filled as -1
| Pixel properties | Quadrant properties | ||||||
|---|---|---|---|---|---|---|---|
| Quadrant | DetID | PixID | Counts | Sigma | Mean | Median | Sigma |
| A | 0 | 50 | 159128 | 407.07 | 1737 | 1692 | 386.8 |
| A | 7 | 16 | 86265 | 218.67 | 1737 | 1692 | 386.8 |
| A | 13 | 14 | 21061 | 50.08 | 1737 | 1692 | 386.8 |
| B | 15 | 204 | 1357019 | 3973.83 | 1743 | 1693 | 341.1 |
| B | 15 | 255 | 837681 | 2451.12 | 1743 | 1693 | 341.1 |
| B | 10 | 16 | 375719 | 1096.65 | 1743 | 1693 | 341.1 |
| C | 1 | 241 | 346023 | 914.35 | 1676 | 1651 | 376.6 |
| C | 1 | 16 | 110566 | 289.18 | 1676 | 1651 | 376.6 |
| C | 9 | 221 | 80096 | 208.28 | 1676 | 1651 | 376.6 |
| D | 2 | 63 | 7435381 | 19028.96 | 1631 | 1567 | 390.7 |
| D | 2 | 152 | 569098 | 1452.76 | 1631 | 1567 | 390.7 |
| D | 12 | 233 | 316674 | 806.61 | 1631 | 1567 | 390.7 |
Histogram calculated using DETX and DETY for each event in the final _common_clean file
| Quadrant A |  |
 |
Quadrant B |
|---|---|---|---|
| Quadrant D |  |
 |
Quadrant C |
| Plot type | Count rate plots | Images |
|---|---|---|
| Comparison with Poisson distribution Blue bars denote a histogram of data divided into 1 sec bins. Red curve is a Poisson curve with rate = median count rate of data. |
 |
 |
| Quadrant-wise count rates Data is divided into 100 sec bins |
 |
|
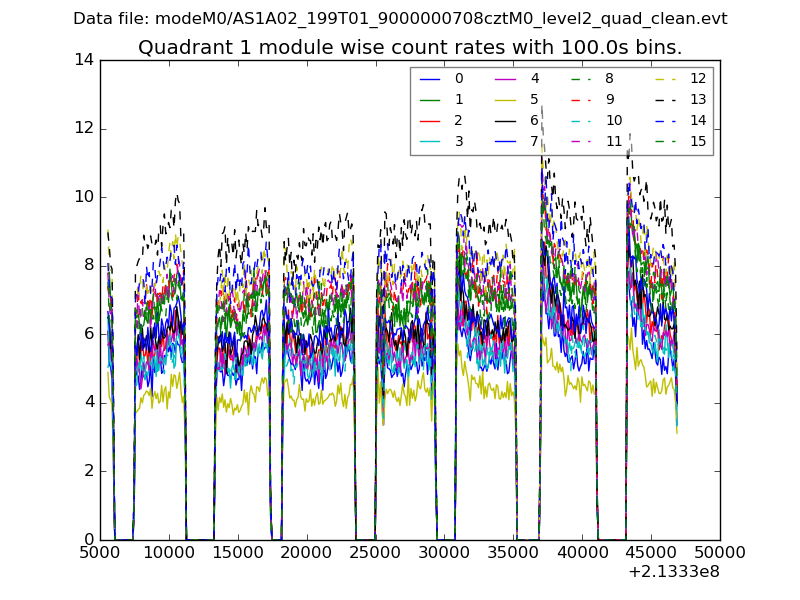
| Module-wise count rates for Quadrant A Data is divided into 100 sec bins |
 |
 |
| Module-wise count rates for Quadrant B Data is divided into 100 sec bins |
 |
 |
| Module-wise count rates for Quadrant C Data is divided into 100 sec bins |
 |
 |
| Module-wise count rates for Quadrant D Data is divided into 100 sec bins |
 |
 |
| Parameter | Plot |
|---|---|
| CZT HV Monitor |  |
| D_VDD |  |
| Temperature 1 |  |
| Veto HV Monitor |  |
| Veto LLD |  |
| Alpha Counter |  |
| _CPM_Rate |  |
| CZT Counter |  |
| +2.5 Volts monitor |  |
| +5 Volts monitor |  |
| _ROLL_ROT | 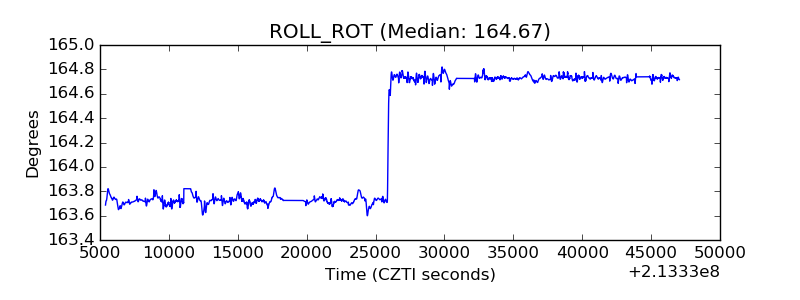 |
| _Roll_DEC |  |
| _Roll_RA |  |
| Veto Counter | 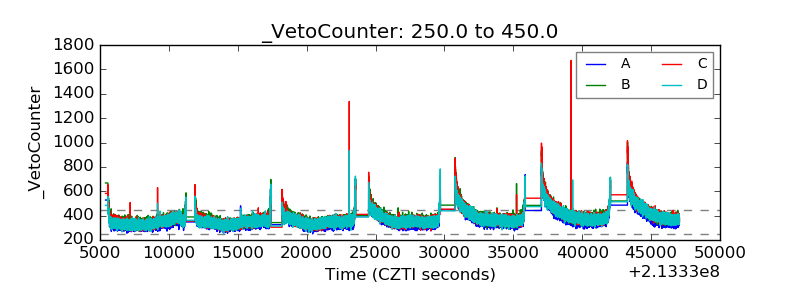 |