| Param | Original file | Final file |
|---|---|---|
| Filename | modeM0/AS1A02_162T01_9000000704cztM0_level2.evt | modeM0/AS1A02_162T01_9000000704cztM0_level2_quad_clean.evt |
| Size (bytes) | 7,594,629,120 | 909,694,080 |
| Size | 7.1 GB | 867.6 MB |
| Events in quadrant A | 41,573,500 | 5,547,957 |
| Events in quadrant B | 81,803,921 | 5,151,257 |
| Events in quadrant C | 49,296,092 | 5,504,524 |
| Events in quadrant D | 51,346,044 | 5,252,178 |
| Mode M0 | |||
|---|---|---|---|
| Quadrant | BADHDUFLAG | Total packets | Discarded packets |
| A | 0 | 186951 | 0 |
| B | 0 | 302749 | 0 |
| C | 0 | 208787 | 0 |
| D | 0 | 215335 | 0 |
| Mode SS | |||
|---|---|---|---|
| Quadrant | BADHDUFLAG | Total packets | Discarded packets |
| A | 0 | 1826 | 0 |
| B | 0 | 1842 | 0 |
| C | 0 | 1812 | 0 |
| D | 0 | 1832 | 0 |
| Mode M9 | |||
|---|---|---|---|
| Quadrant | BADHDUFLAG | Total packets | Discarded packets |
| A | 0 | 163 | 0 |
| B | 0 | 162 | 0 |
| C | 0 | 163 | 0 |
| D | 0 | 161 | 0 |
| Quadrant | Total seconds | Saturated seconds | Saturation percentage |
|---|---|---|---|
| A | 89238 | 1287 | 1.442211% |
| B | 87690 | 11140 | 12.703843% |
| C | 89222 | 3040 | 3.407231% |
| D | 89148 | 2089 | 2.343294% |
Noise dominated data is calculated using 1-second bins in cleaned event files. If a bin has >2000 counts, and if more than 50% of those come from <1% of pixels, then it is considered to be noise-dominated and hence unusable.
| Quadrant | # 1 sec bins | Bins with >0 counts | Bins with >2000 counts | High rate bins dominated by noise | Noise dominated (total time) | Noise dominated (detector-on time) | Marked lightcurve |
|---|---|---|---|---|---|---|---|
| A | 109120 | 91126 | 245 | 245 | 0.22% | 0.27% |  |
| B | 109120 | 89830 | 8319 | 8319 | 7.62% | 9.26% |  |
| C | 109120 | 91136 | 1916 | 1916 | 1.76% | 2.10% |  |
| D | 109120 | 91093 | 1045 | 1045 | 0.96% | 1.15% |  |
Top three noisy pixels from each quadrant. If the there are fewer than three noisy pixels in the level2.evt file, extra rows are filled as -1
| Pixel properties | Quadrant properties | ||||||
|---|---|---|---|---|---|---|---|
| Quadrant | DetID | PixID | Counts | Sigma | Mean | Median | Sigma |
| A | 0 | 50 | 1189901 | 556.23 | 10430 | 10205 | 2120.9 |
| A | 12 | 194 | 103391 | 43.94 | 10430 | 10205 | 2120.9 |
| A | 0 | 226 | 103242 | 43.87 | 10430 | 10205 | 2120.9 |
| B | 15 | 255 | 35312014 | 18664.84 | 9999 | 9762 | 1891.4 |
| B | 15 | 204 | 5326242 | 2810.9 | 9999 | 9762 | 1891.4 |
| B | 4 | 48 | 782343 | 408.48 | 9999 | 9762 | 1891.4 |
| C | 9 | 247 | 5304093 | 2324.03 | 9944 | 9985 | 2278.0 |
| C | 1 | 241 | 3346049 | 1464.48 | 9944 | 9985 | 2278.0 |
| C | 1 | 16 | 1650191 | 720.02 | 9944 | 9985 | 2278.0 |
| D | 2 | 63 | 5091584 | 2082.79 | 10029 | 9718 | 2439.9 |
| D | 2 | 152 | 2596150 | 1060.04 | 10029 | 9718 | 2439.9 |
| D | 2 | 136 | 1810401 | 738.0 | 10029 | 9718 | 2439.9 |
Histogram calculated using DETX and DETY for each event in the final _common_clean file
| Quadrant A |  |
 |
Quadrant B |
|---|---|---|---|
| Quadrant D |  |
 |
Quadrant C |
| Plot type | Count rate plots | Images |
|---|---|---|
| Comparison with Poisson distribution Blue bars denote a histogram of data divided into 1 sec bins. Red curve is a Poisson curve with rate = median count rate of data. |
 |
 |
| Quadrant-wise count rates Data is divided into 100 sec bins |
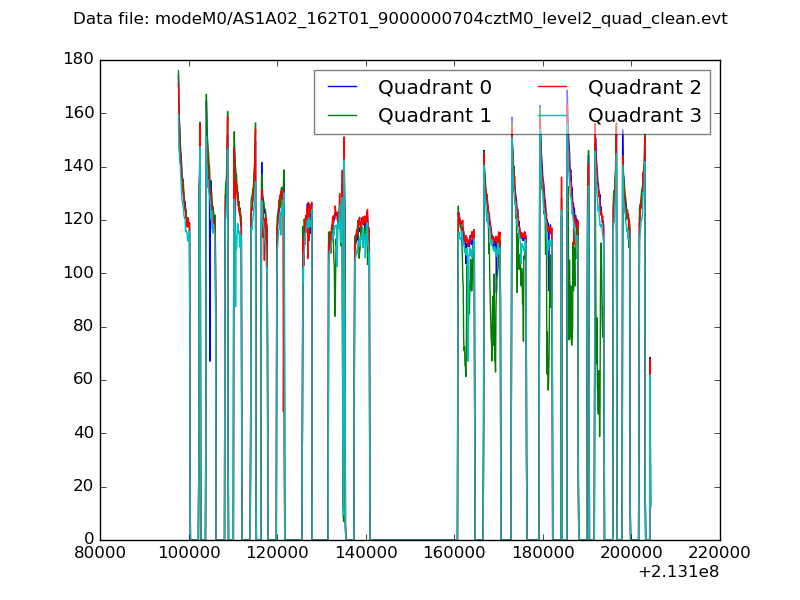 |
|
| Module-wise count rates for Quadrant A Data is divided into 100 sec bins |
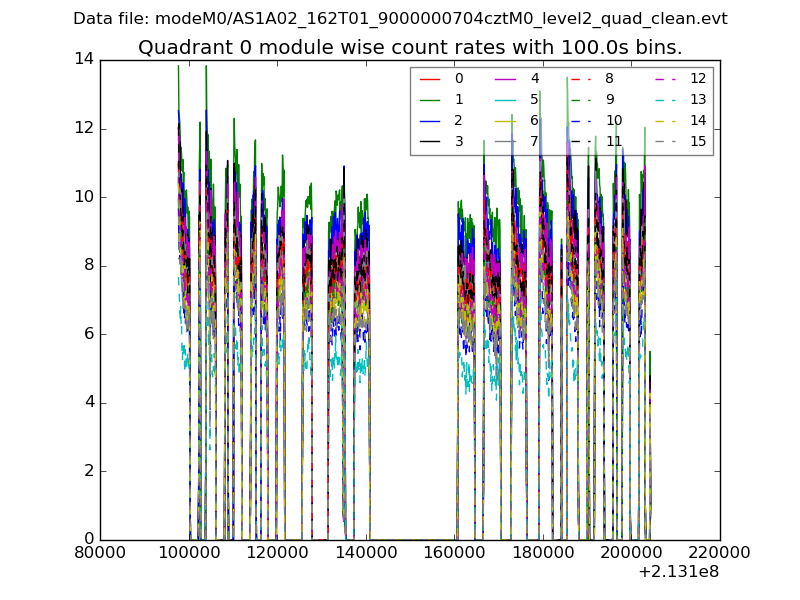 |
 |
| Module-wise count rates for Quadrant B Data is divided into 100 sec bins |
 |
 |
| Module-wise count rates for Quadrant C Data is divided into 100 sec bins |
 |
 |
| Module-wise count rates for Quadrant D Data is divided into 100 sec bins |
 |
 |
| Parameter | Plot |
|---|---|
| CZT HV Monitor | 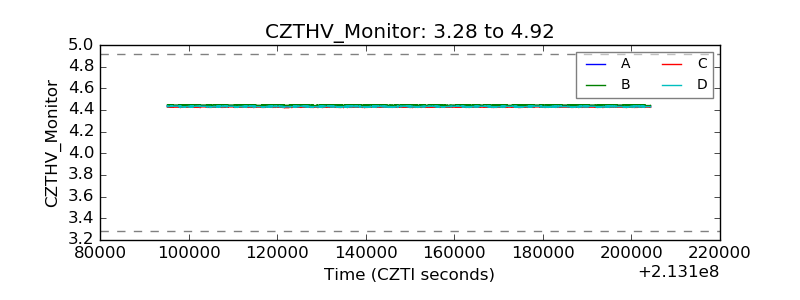 |
| D_VDD |  |
| Temperature 1 |  |
| Veto HV Monitor |  |
| Veto LLD |  |
| Alpha Counter |  |
| _CPM_Rate |  |
| CZT Counter |  |
| +2.5 Volts monitor |  |
| +5 Volts monitor |  |
| _ROLL_ROT |  |
| _Roll_DEC |  |
| _Roll_RA |  |
| Veto Counter |  |